| __timestamp | Hubbell Incorporated | Parker-Hannifin Corporation |
|---|---|---|
| Wednesday, January 1, 2014 | 594700000 | 1832903000 |
| Thursday, January 1, 2015 | 533600000 | 1861551000 |
| Friday, January 1, 2016 | 564700000 | 1558088000 |
| Sunday, January 1, 2017 | 585600000 | 1846306000 |
| Monday, January 1, 2018 | 677500000 | 2382235000 |
| Tuesday, January 1, 2019 | 740900000 | 2513468000 |
| Wednesday, January 1, 2020 | 671400000 | 2431500000 |
| Friday, January 1, 2021 | 661000000 | 3092383000 |
| Saturday, January 1, 2022 | 854300000 | 2441242000 |
| Sunday, January 1, 2023 | 1169700000 | 4071687000 |
| Monday, January 1, 2024 | 1291200000 | 5028229000 |
Igniting the spark of knowledge
In the competitive landscape of industrial manufacturing, Parker-Hannifin Corporation and Hubbell Incorporated have showcased distinct EBITDA trajectories over the past decade. Since 2014, Parker-Hannifin has consistently outperformed Hubbell, with its EBITDA growing by approximately 175% by 2023. This growth underscores Parker-Hannifin's strategic prowess in optimizing operational efficiencies and expanding market reach.
Conversely, Hubbell Incorporated, while experiencing a steady rise, saw its EBITDA increase by about 97% over the same period. Notably, 2023 marked a significant leap for Hubbell, with a 37% increase from the previous year, reflecting successful strategic initiatives.
The data reveals a missing value for Hubbell in 2024, suggesting potential reporting delays or strategic shifts. As these industrial titans continue to evolve, stakeholders should watch for emerging trends and strategic pivots that could redefine their financial landscapes.
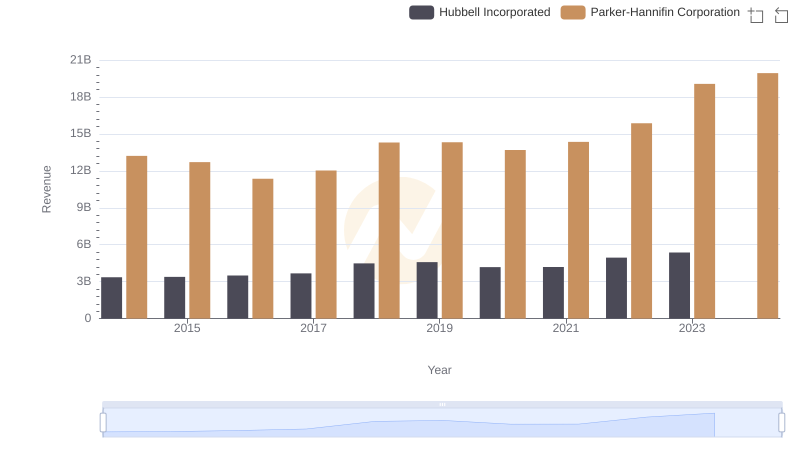
Parker-Hannifin Corporation or Hubbell Incorporated: Who Leads in Yearly Revenue?
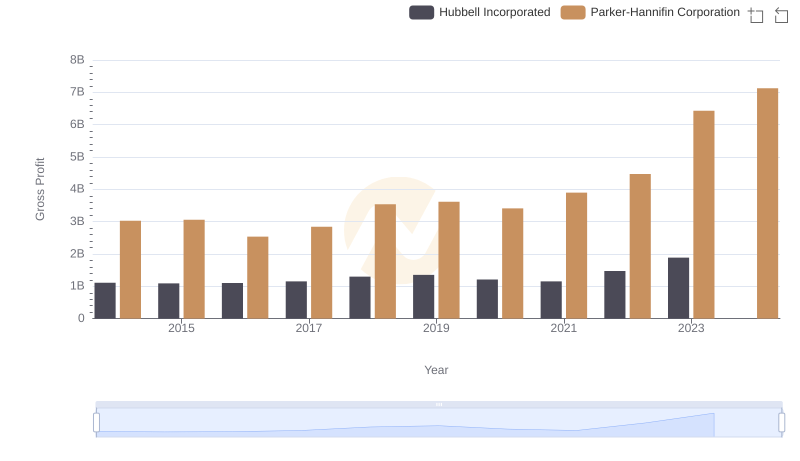
Gross Profit Comparison: Parker-Hannifin Corporation and Hubbell Incorporated Trends
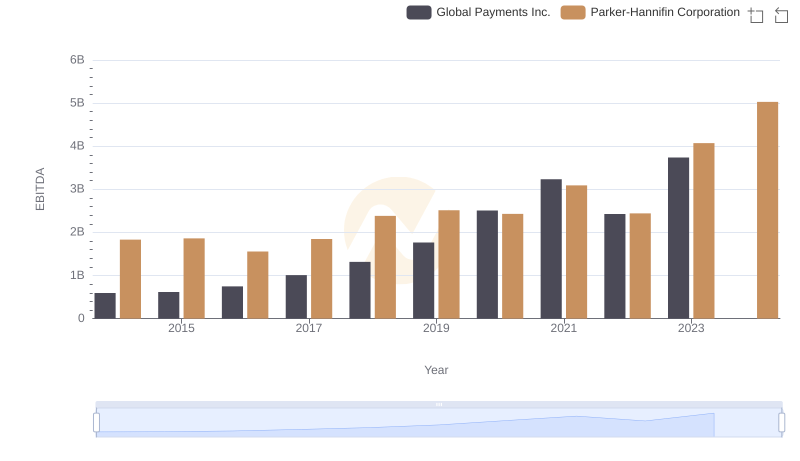
EBITDA Performance Review: Parker-Hannifin Corporation vs Global Payments Inc.
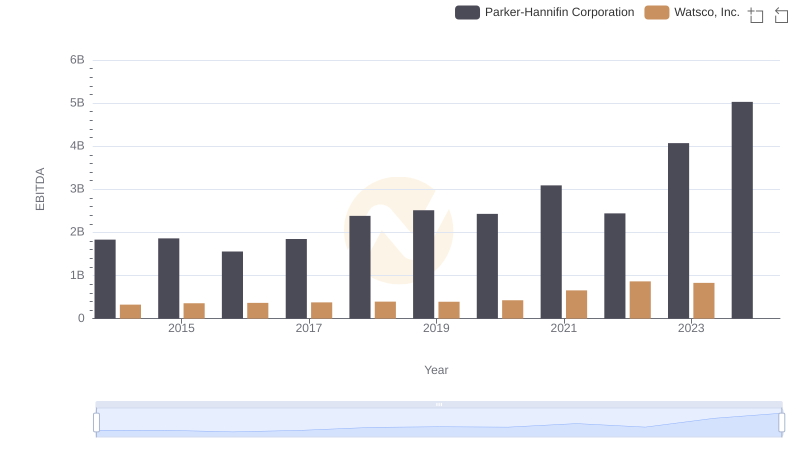
EBITDA Analysis: Evaluating Parker-Hannifin Corporation Against Watsco, Inc.
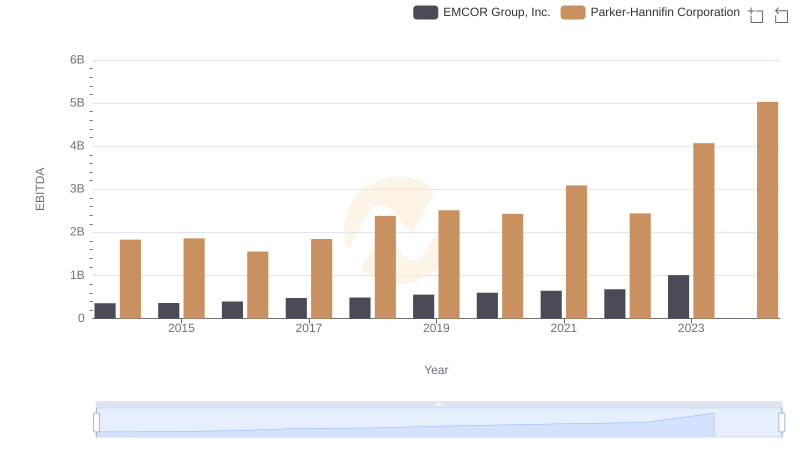
Comprehensive EBITDA Comparison: Parker-Hannifin Corporation vs EMCOR Group, Inc.
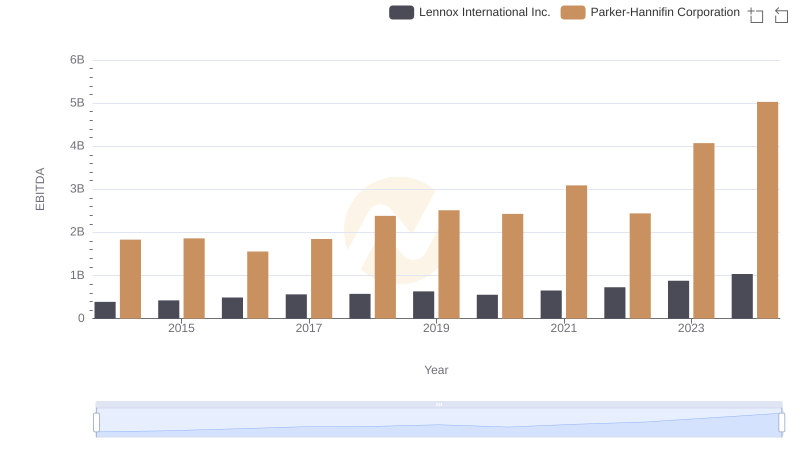
Professional EBITDA Benchmarking: Parker-Hannifin Corporation vs Lennox International Inc.
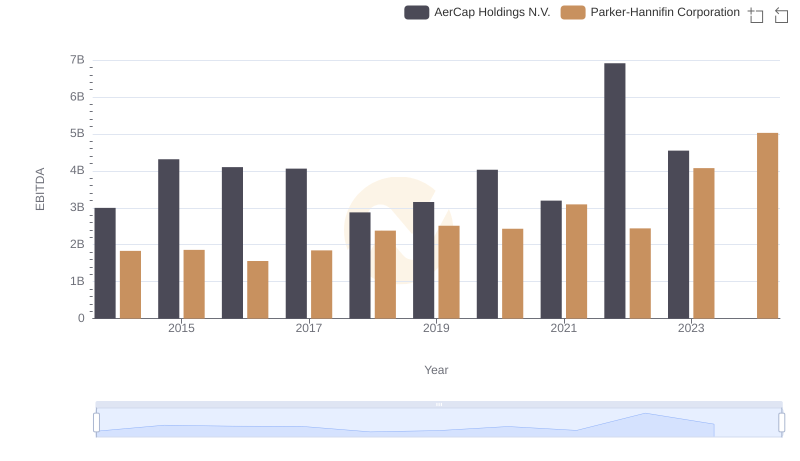
Parker-Hannifin Corporation and AerCap Holdings N.V.: A Detailed Examination of EBITDA Performance