| __timestamp | AerCap Holdings N.V. | Parker-Hannifin Corporation |
|---|---|---|
| Wednesday, January 1, 2014 | 3535797000 | 13215971000 |
| Thursday, January 1, 2015 | 5598662000 | 12711744000 |
| Friday, January 1, 2016 | 5152131000 | 11360753000 |
| Sunday, January 1, 2017 | 5037493000 | 12029312000 |
| Monday, January 1, 2018 | 4799980000 | 14302392000 |
| Tuesday, January 1, 2019 | 4937340000 | 14320324000 |
| Wednesday, January 1, 2020 | 4493629000 | 13695520000 |
| Friday, January 1, 2021 | 4588930000 | 14347640000 |
| Saturday, January 1, 2022 | 6914985000 | 15861608000 |
| Sunday, January 1, 2023 | 7574664000 | 19065194000 |
| Monday, January 1, 2024 | 19929606000 |
In pursuit of knowledge
In the ever-evolving landscape of industrial and aviation sectors, Parker-Hannifin Corporation and AerCap Holdings N.V. stand as titans. Over the past decade, Parker-Hannifin has consistently outperformed AerCap in annual revenue, showcasing a robust growth trajectory. From 2014 to 2023, Parker-Hannifin's revenue surged by approximately 44%, peaking at nearly $19 billion in 2023. In contrast, AerCap Holdings experienced a more modest growth of around 114% during the same period, reaching over $7.5 billion in 2023.
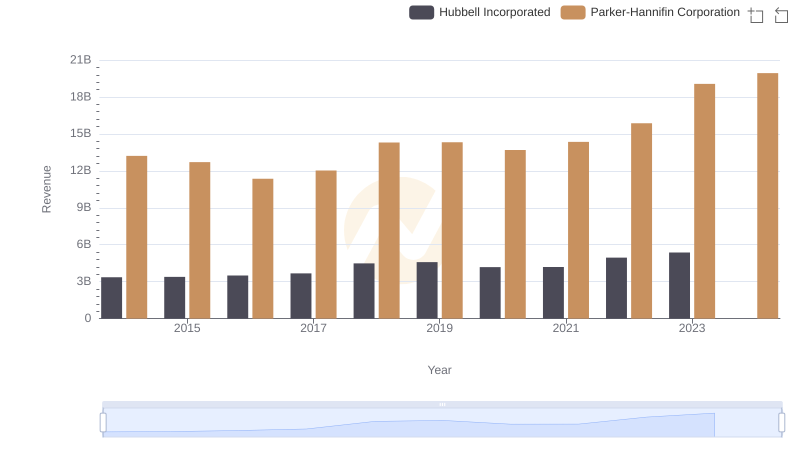
Parker-Hannifin Corporation or Hubbell Incorporated: Who Leads in Yearly Revenue?
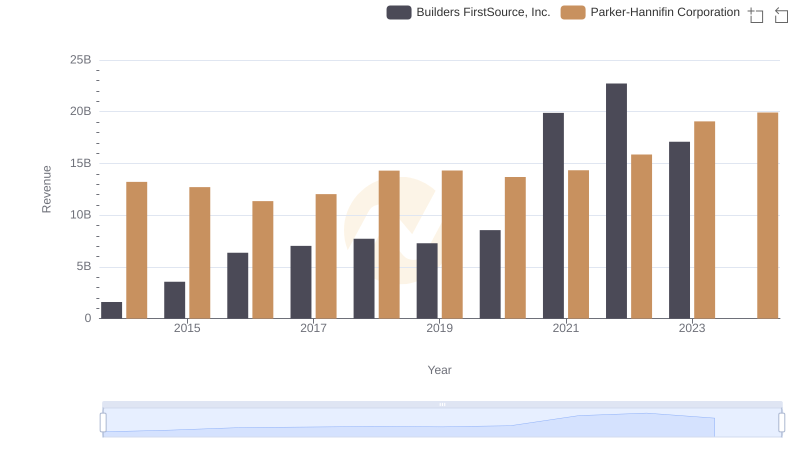
Annual Revenue Comparison: Parker-Hannifin Corporation vs Builders FirstSource, Inc.
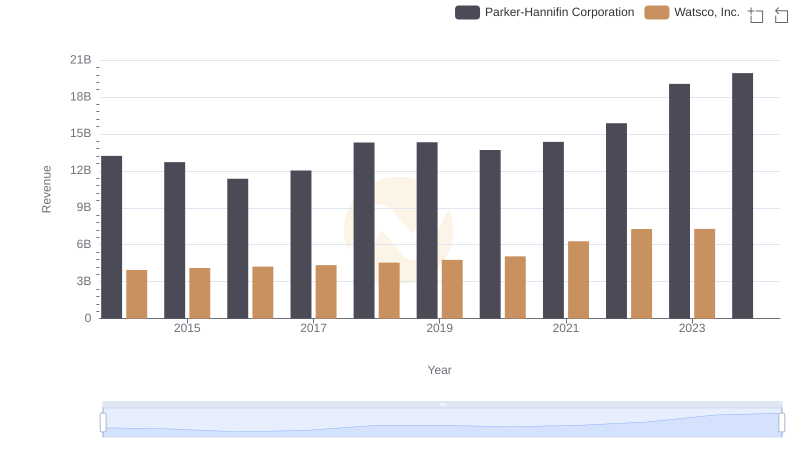
Who Generates More Revenue? Parker-Hannifin Corporation or Watsco, Inc.
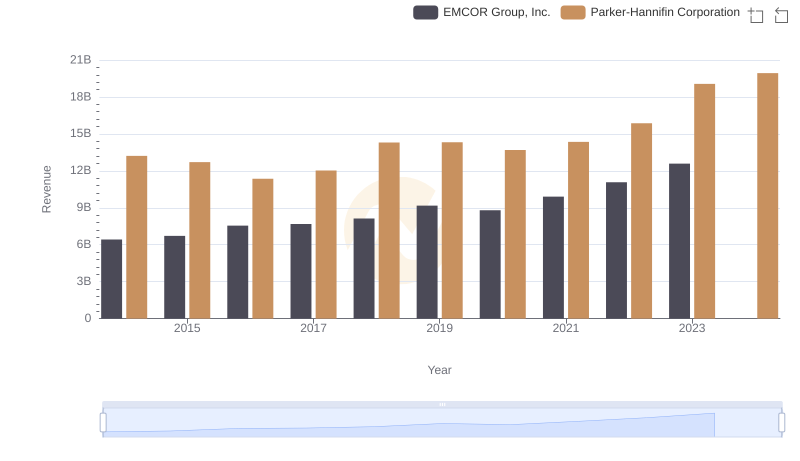
Who Generates More Revenue? Parker-Hannifin Corporation or EMCOR Group, Inc.
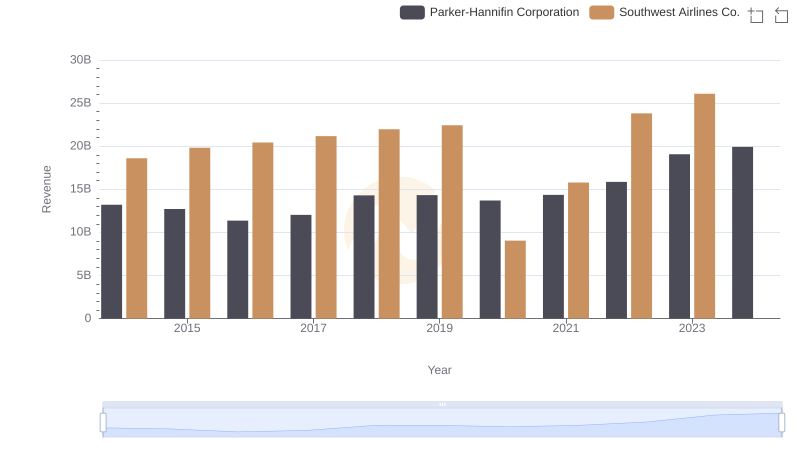
Parker-Hannifin Corporation vs Southwest Airlines Co.: Examining Key Revenue Metrics
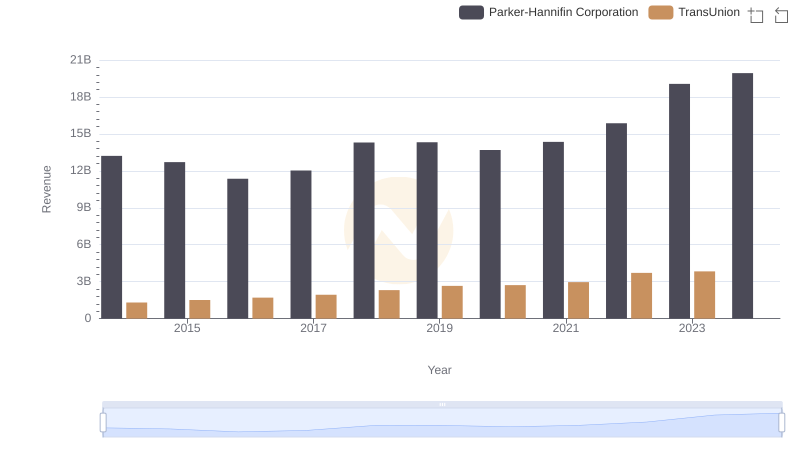
Parker-Hannifin Corporation or TransUnion: Who Leads in Yearly Revenue?
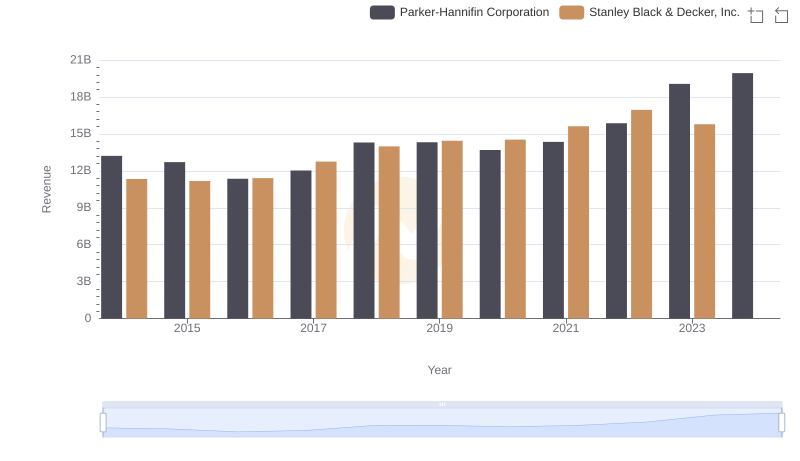
Parker-Hannifin Corporation and Stanley Black & Decker, Inc.: A Comprehensive Revenue Analysis
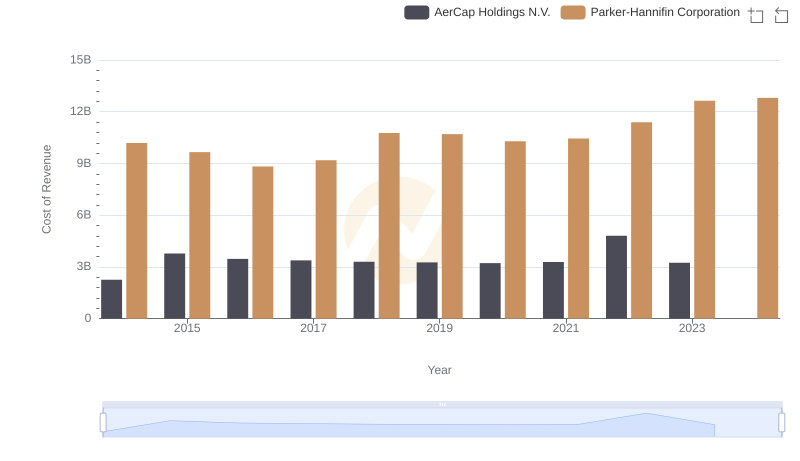
Cost of Revenue Trends: Parker-Hannifin Corporation vs AerCap Holdings N.V.
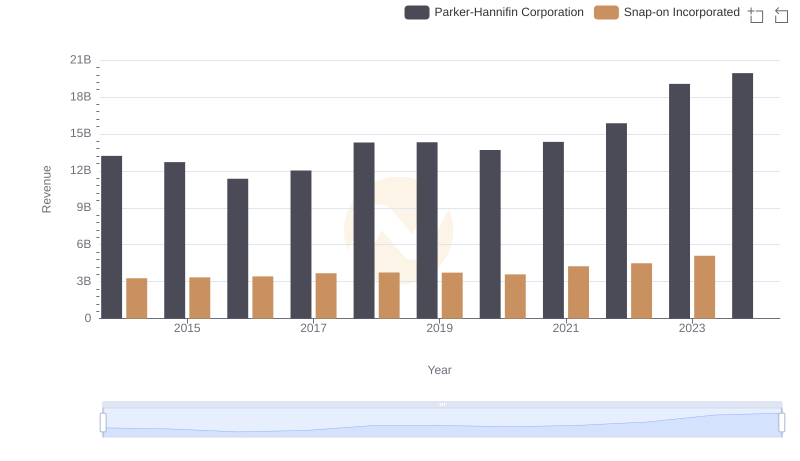
Revenue Showdown: Parker-Hannifin Corporation vs Snap-on Incorporated
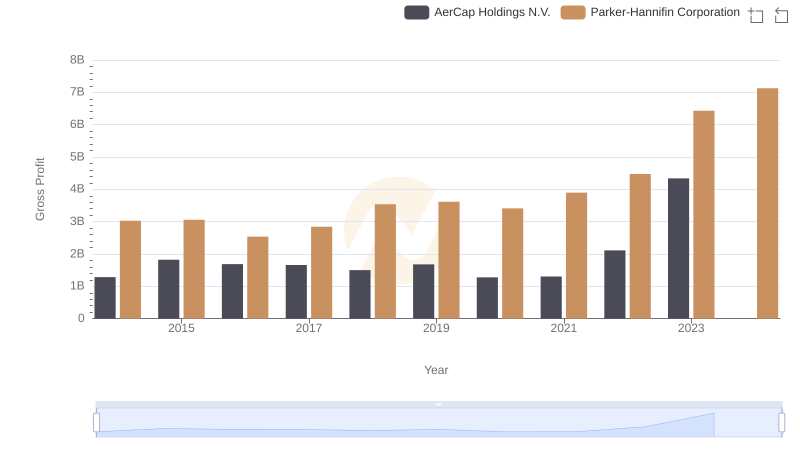
Gross Profit Trends Compared: Parker-Hannifin Corporation vs AerCap Holdings N.V.
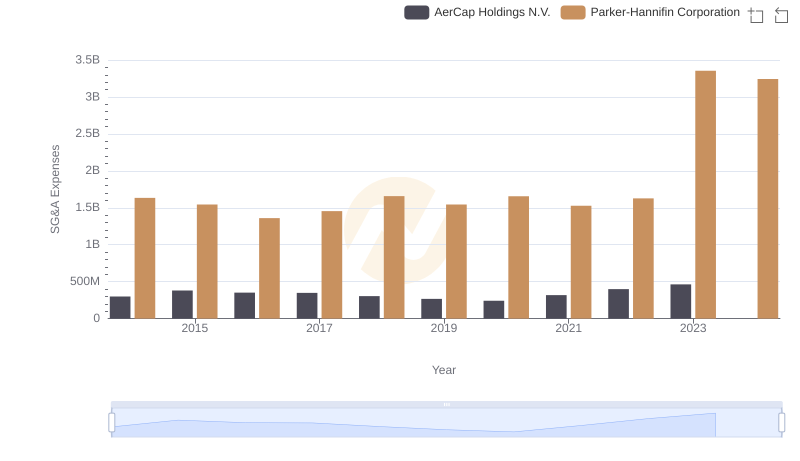
Who Optimizes SG&A Costs Better? Parker-Hannifin Corporation or AerCap Holdings N.V.
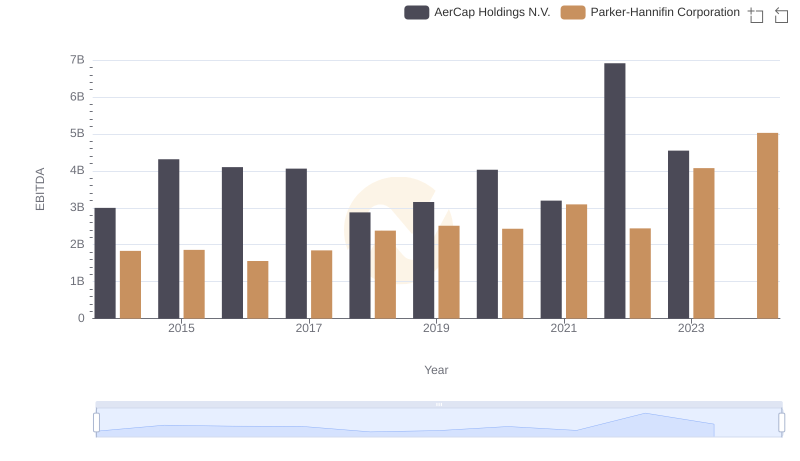
Parker-Hannifin Corporation and AerCap Holdings N.V.: A Detailed Examination of EBITDA Performance