| __timestamp | Parker-Hannifin Corporation | Stanley Black & Decker, Inc. |
|---|---|---|
| Wednesday, January 1, 2014 | 1832903000 | 1975400000 |
| Thursday, January 1, 2015 | 1861551000 | 1741900000 |
| Friday, January 1, 2016 | 1558088000 | 1810200000 |
| Sunday, January 1, 2017 | 1846306000 | 2196000000 |
| Monday, January 1, 2018 | 2382235000 | 1791200000 |
| Tuesday, January 1, 2019 | 2513468000 | 1920600000 |
| Wednesday, January 1, 2020 | 2431500000 | 2004200000 |
| Friday, January 1, 2021 | 3092383000 | 2345500000 |
| Saturday, January 1, 2022 | 2441242000 | 942800000 |
| Sunday, January 1, 2023 | 4071687000 | 802700000 |
| Monday, January 1, 2024 | 5028229000 | 286300000 |
In pursuit of knowledge
In the ever-evolving landscape of industrial manufacturing, Parker-Hannifin Corporation and Stanley Black & Decker, Inc. have long been titans. Over the past decade, Parker-Hannifin has demonstrated a robust growth trajectory, with its EBITDA surging by approximately 175% from 2014 to 2023. This impressive growth is highlighted by a significant leap in 2023, where EBITDA reached a peak of over 5 billion, marking a 24% increase from the previous year.
Conversely, Stanley Black & Decker faced challenges, with a notable decline in EBITDA by 59% from 2021 to 2023. This downturn reflects broader market pressures and strategic shifts within the company. The absence of data for 2024 suggests potential restructuring or reporting changes.
As these industry leaders navigate the complexities of global markets, their financial performance offers valuable insights into strategic resilience and adaptability.
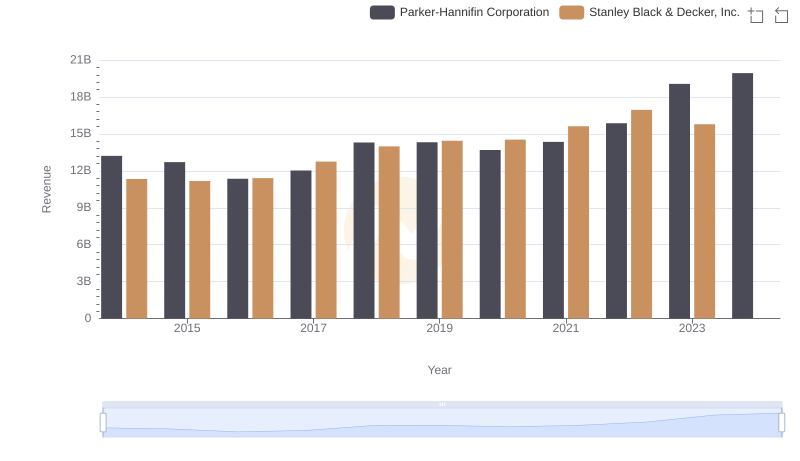
Parker-Hannifin Corporation and Stanley Black & Decker, Inc.: A Comprehensive Revenue Analysis

Cost of Revenue Trends: Parker-Hannifin Corporation vs Stanley Black & Decker, Inc.

Parker-Hannifin Corporation and Stanley Black & Decker, Inc.: A Detailed Gross Profit Analysis

Research and Development Expenses Breakdown: Parker-Hannifin Corporation vs Stanley Black & Decker, Inc.
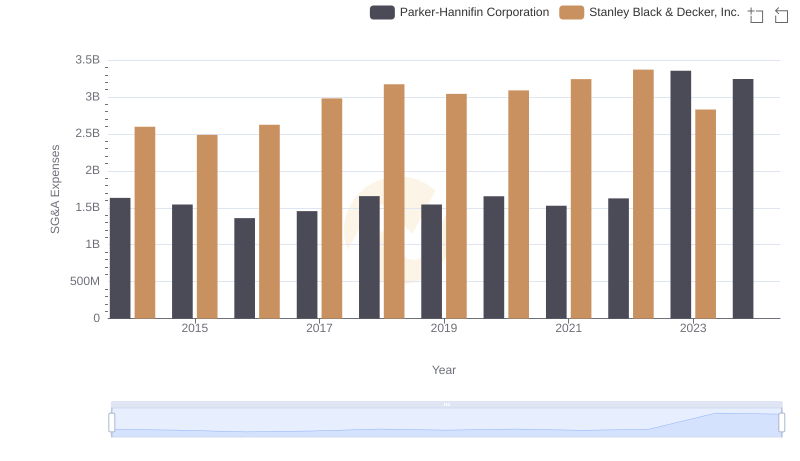
Operational Costs Compared: SG&A Analysis of Parker-Hannifin Corporation and Stanley Black & Decker, Inc.
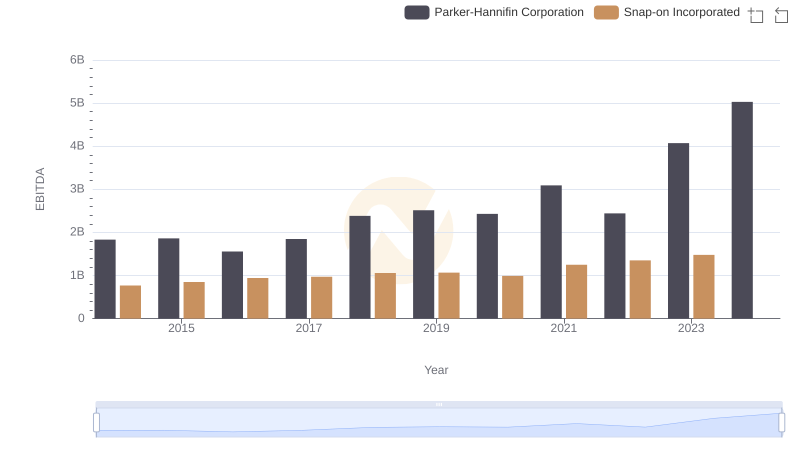
EBITDA Performance Review: Parker-Hannifin Corporation vs Snap-on Incorporated

Parker-Hannifin Corporation and Stanley Black & Decker, Inc.: A Comprehensive Revenue Analysis
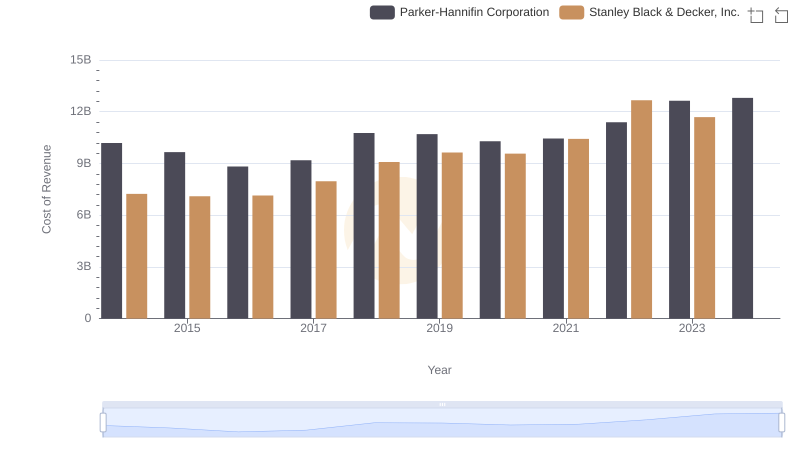
Analyzing Cost of Revenue: Parker-Hannifin Corporation and Stanley Black & Decker, Inc.
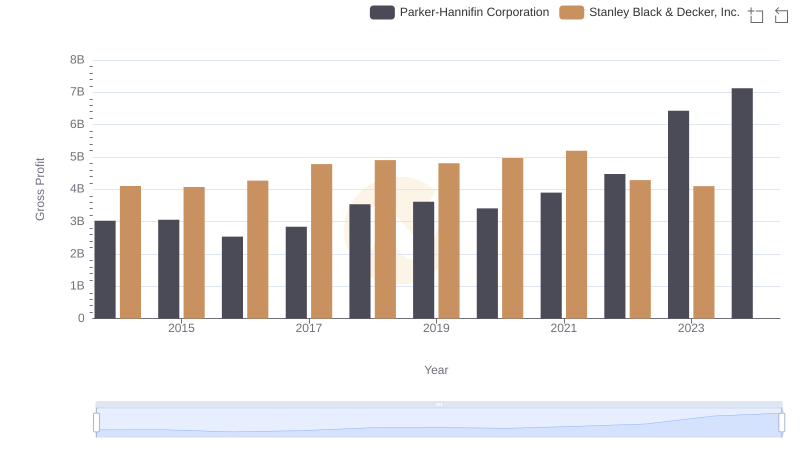
Gross Profit Comparison: Parker-Hannifin Corporation and Stanley Black & Decker, Inc. Trends
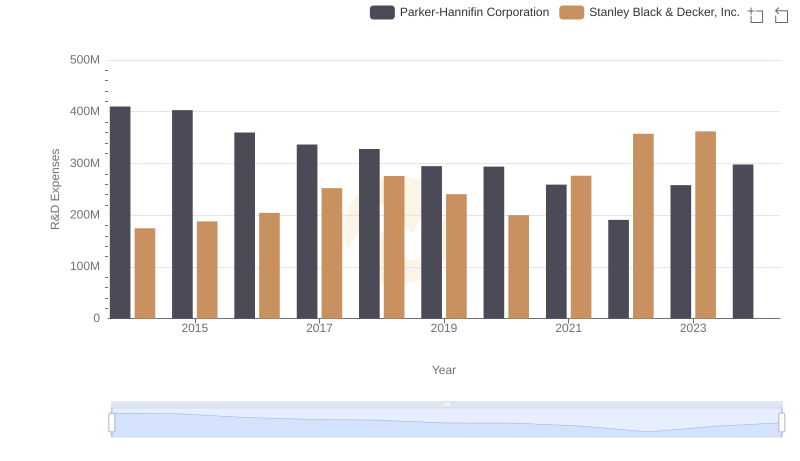
Parker-Hannifin Corporation or Stanley Black & Decker, Inc.: Who Invests More in Innovation?
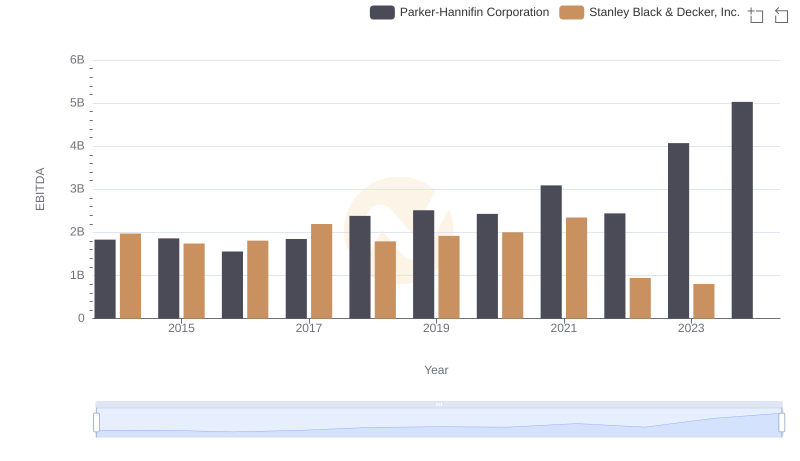
Parker-Hannifin Corporation vs Stanley Black & Decker, Inc.: In-Depth EBITDA Performance Comparison