| __timestamp | ASE Technology Holding Co., Ltd. | Adobe Inc. |
|---|---|---|
| Wednesday, January 1, 2014 | 13673000000 | 2215140000 |
| Thursday, January 1, 2015 | 14295000000 | 2215161000 |
| Friday, January 1, 2016 | 15099000000 | 2487907000 |
| Sunday, January 1, 2017 | 15767000000 | 2822298000 |
| Monday, January 1, 2018 | 19552000000 | 3365727000 |
| Tuesday, January 1, 2019 | 22389000000 | 4124984000 |
| Wednesday, January 1, 2020 | 23806000000 | 4559000000 |
| Friday, January 1, 2021 | 27191000000 | 5406000000 |
| Saturday, January 1, 2022 | 30384000000 | 6187000000 |
| Sunday, January 1, 2023 | 25930017000 | 6764000000 |
| Monday, January 1, 2024 | 27353513000 | 7293000000 |
In pursuit of knowledge
In the ever-evolving landscape of technology, operational efficiency is paramount. This analysis delves into the Selling, General, and Administrative (SG&A) expenses of two industry giants: Adobe Inc. and ASE Technology Holding Co., Ltd., from 2014 to 2023. Adobe, a leader in digital media and marketing solutions, has seen its SG&A expenses grow by approximately 230% over the decade, reflecting its strategic investments in innovation and market expansion. In contrast, ASE Technology, a titan in semiconductor manufacturing, experienced a 90% increase in SG&A costs, highlighting its focus on scaling operations and maintaining competitive advantage. Notably, 2023 saw a dip in ASE's expenses, possibly indicating a shift towards cost optimization. This comparative insight underscores the diverse strategies employed by these companies to navigate the competitive tech landscape.
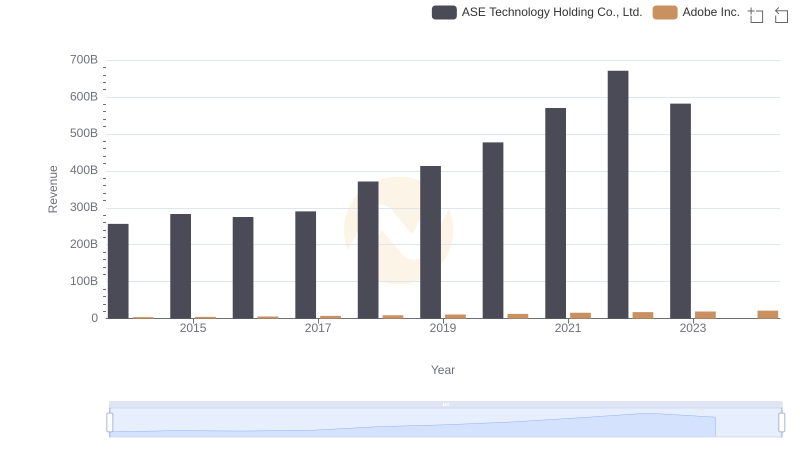
Revenue Insights: Adobe Inc. and ASE Technology Holding Co., Ltd. Performance Compared
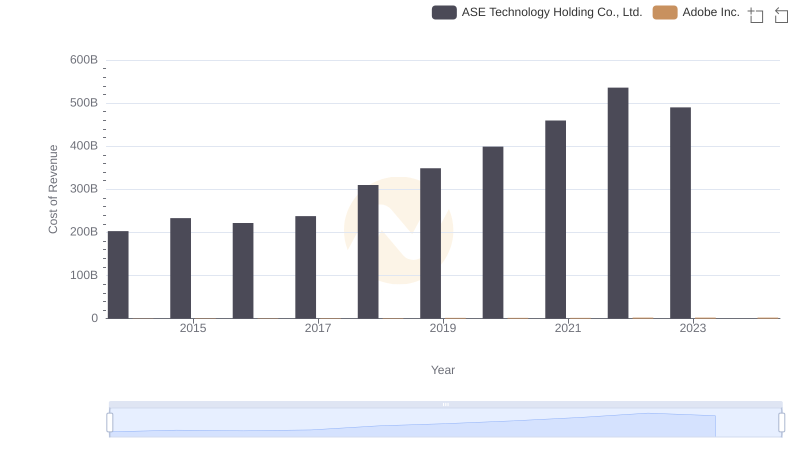
Comparing Cost of Revenue Efficiency: Adobe Inc. vs ASE Technology Holding Co., Ltd.
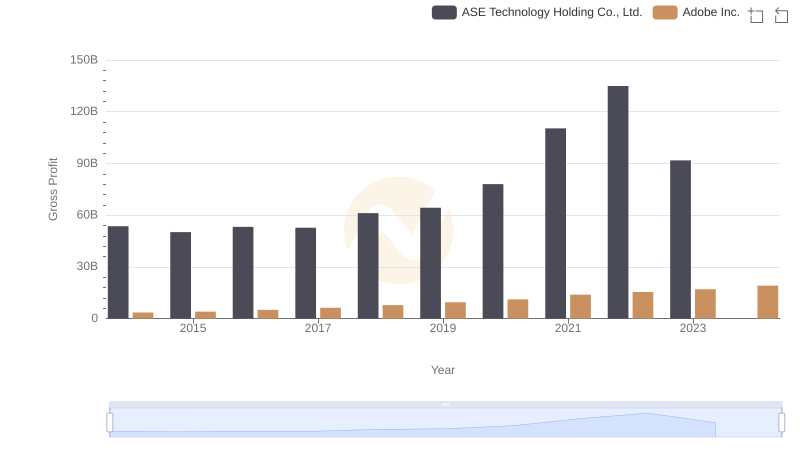
Adobe Inc. vs ASE Technology Holding Co., Ltd.: A Gross Profit Performance Breakdown
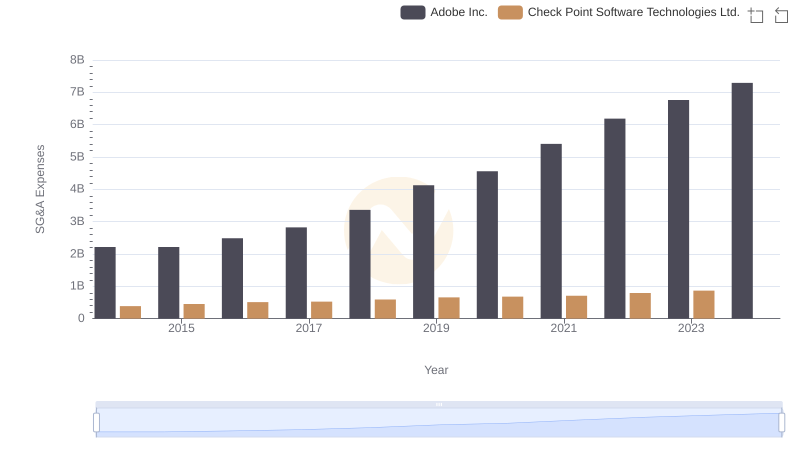
Adobe Inc. and Check Point Software Technologies Ltd.: SG&A Spending Patterns Compared
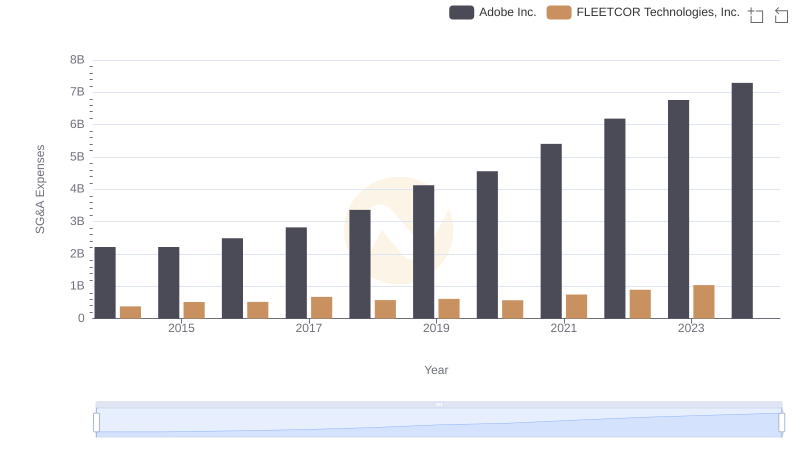
Adobe Inc. or FLEETCOR Technologies, Inc.: Who Manages SG&A Costs Better?
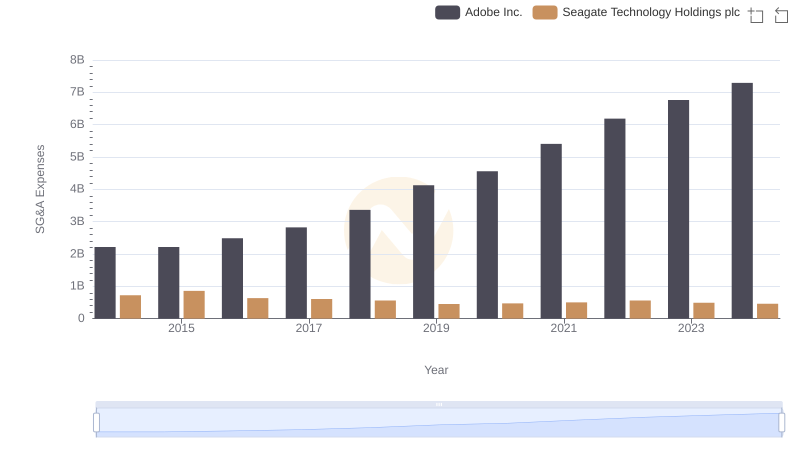
Operational Costs Compared: SG&A Analysis of Adobe Inc. and Seagate Technology Holdings plc
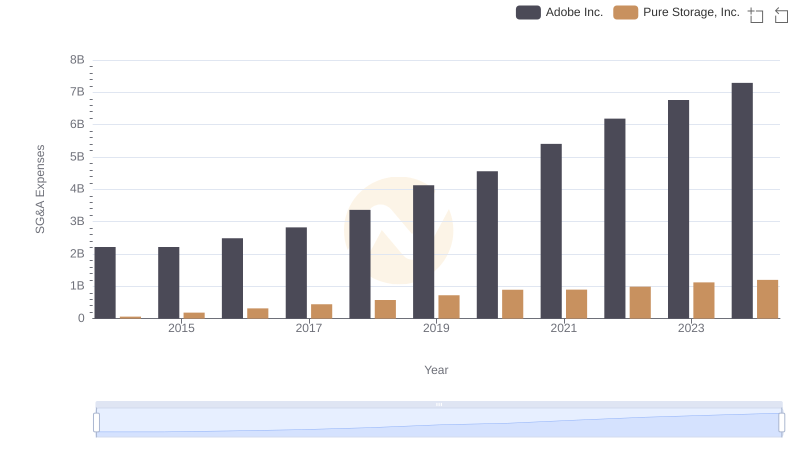
Comparing SG&A Expenses: Adobe Inc. vs Pure Storage, Inc. Trends and Insights
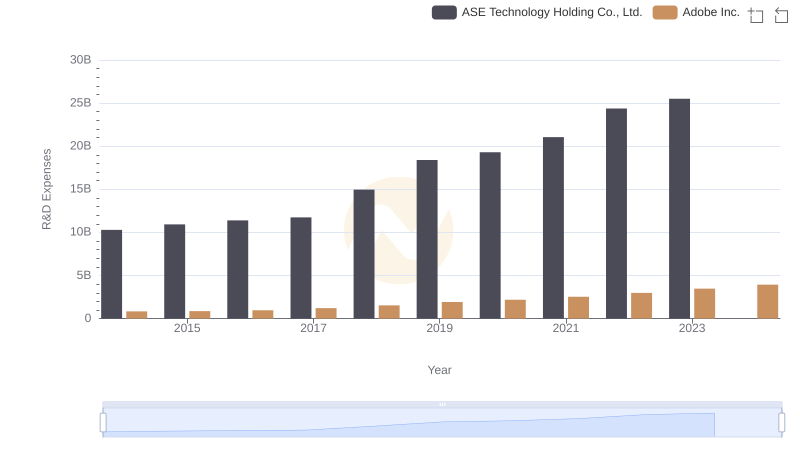
Research and Development Investment: Adobe Inc. vs ASE Technology Holding Co., Ltd.

Comparing SG&A Expenses: Adobe Inc. vs Zebra Technologies Corporation Trends and Insights
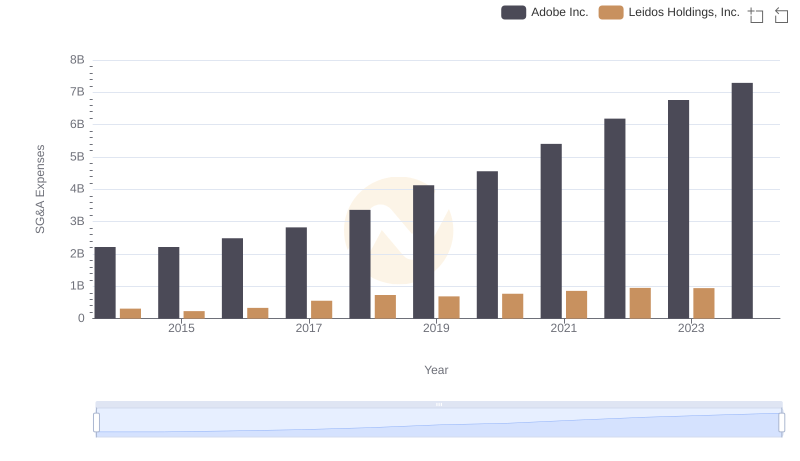
Comparing SG&A Expenses: Adobe Inc. vs Leidos Holdings, Inc. Trends and Insights

Comparing SG&A Expenses: Adobe Inc. vs SS&C Technologies Holdings, Inc. Trends and Insights
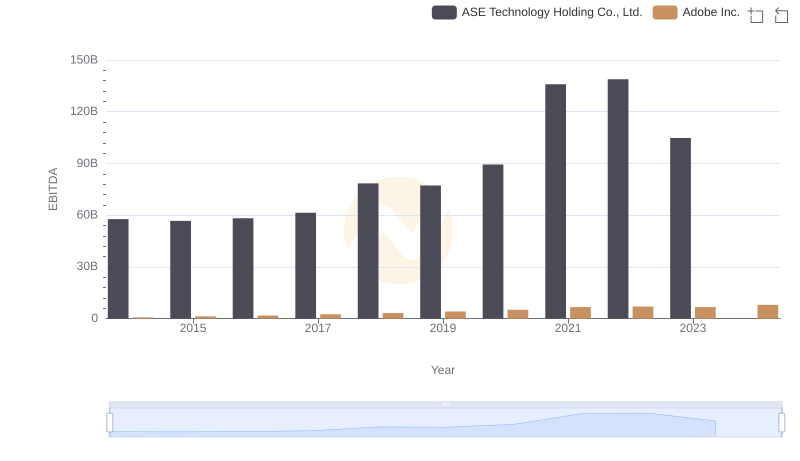
EBITDA Metrics Evaluated: Adobe Inc. vs ASE Technology Holding Co., Ltd.