| __timestamp | Adobe Inc. | Pure Storage, Inc. |
|---|---|---|
| Wednesday, January 1, 2014 | 2215140000 | 60652000 |
| Thursday, January 1, 2015 | 2215161000 | 184674000 |
| Friday, January 1, 2016 | 2487907000 | 315976000 |
| Sunday, January 1, 2017 | 2822298000 | 444687000 |
| Monday, January 1, 2018 | 3365727000 | 575200000 |
| Tuesday, January 1, 2019 | 4124984000 | 721617000 |
| Wednesday, January 1, 2020 | 4559000000 | 891175000 |
| Friday, January 1, 2021 | 5406000000 | 898491000 |
| Saturday, January 1, 2022 | 6187000000 | 988982000 |
| Sunday, January 1, 2023 | 6764000000 | 1121605000 |
| Monday, January 1, 2024 | 7293000000 | 1197264000 |
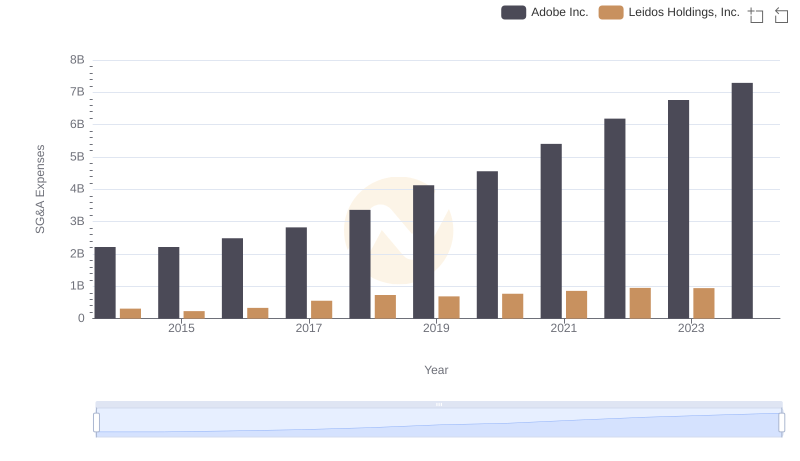
Unveiling the hidden dimensions of data
In the ever-evolving landscape of technology, understanding the financial dynamics of industry leaders is crucial. This chart offers a fascinating glimpse into the Selling, General, and Administrative (SG&A) expenses of Adobe Inc. and Pure Storage, Inc. over the past decade. Adobe, a titan in digital media and marketing solutions, has seen its SG&A expenses grow by approximately 230% from 2014 to 2024, reflecting its expansive growth and strategic investments. In contrast, Pure Storage, a leader in data storage solutions, has experienced a staggering 1,870% increase in the same period, indicative of its aggressive market penetration and scaling efforts. While Adobe's expenses are significantly higher, Pure Storage's rapid growth trajectory highlights its potential to disrupt the market. This comparison not only underscores the distinct strategies of these companies but also offers insights into their future directions.
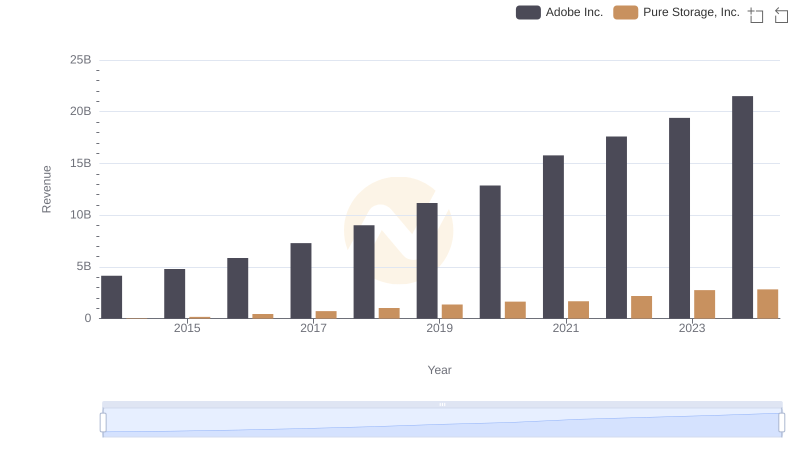
Who Generates More Revenue? Adobe Inc. or Pure Storage, Inc.

Cost Insights: Breaking Down Adobe Inc. and Pure Storage, Inc.'s Expenses

SG&A Efficiency Analysis: Comparing Adobe Inc. and STMicroelectronics N.V.
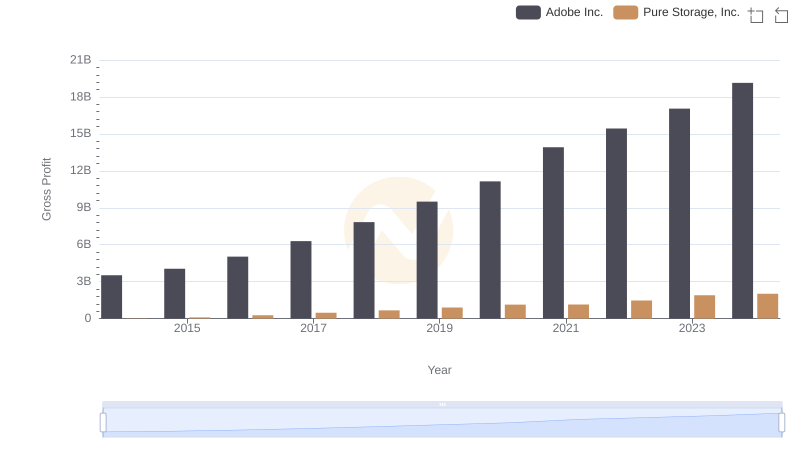
Gross Profit Comparison: Adobe Inc. and Pure Storage, Inc. Trends
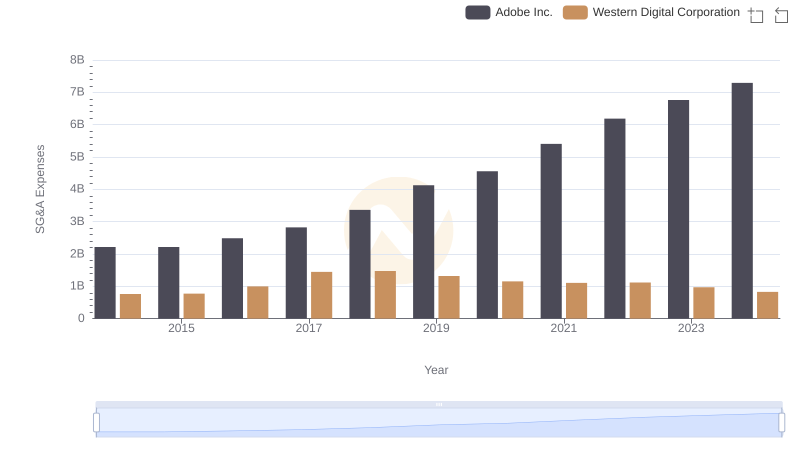
Adobe Inc. vs Western Digital Corporation: SG&A Expense Trends
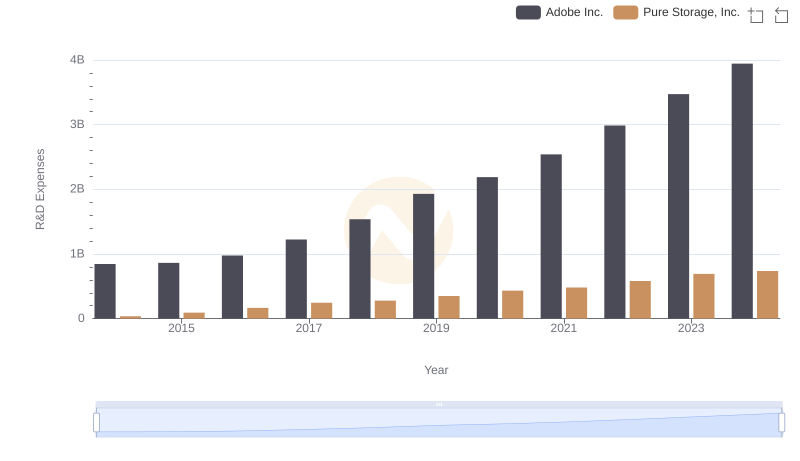
R&D Spending Showdown: Adobe Inc. vs Pure Storage, Inc.
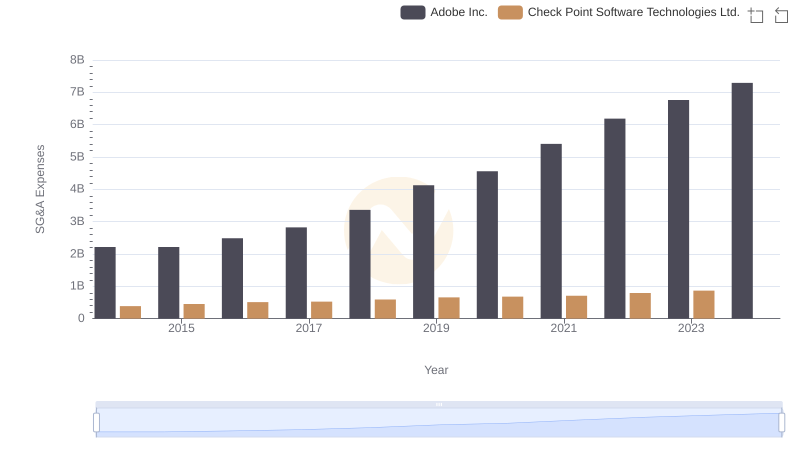
Adobe Inc. and Check Point Software Technologies Ltd.: SG&A Spending Patterns Compared
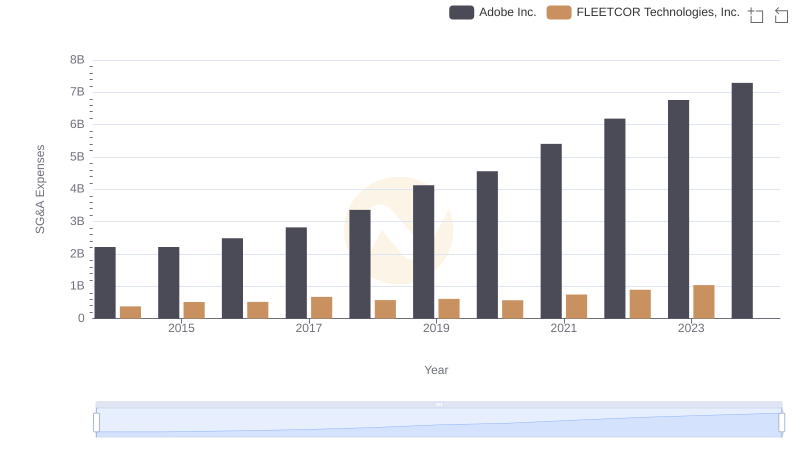
Adobe Inc. or FLEETCOR Technologies, Inc.: Who Manages SG&A Costs Better?
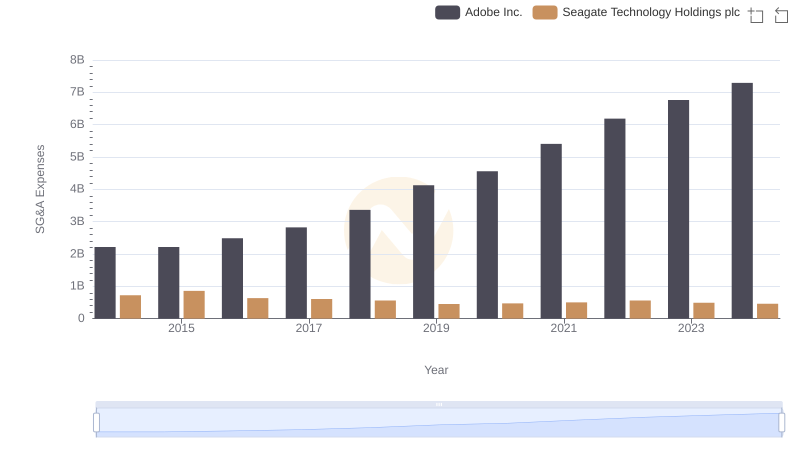
Operational Costs Compared: SG&A Analysis of Adobe Inc. and Seagate Technology Holdings plc

Comparing SG&A Expenses: Adobe Inc. vs Zebra Technologies Corporation Trends and Insights
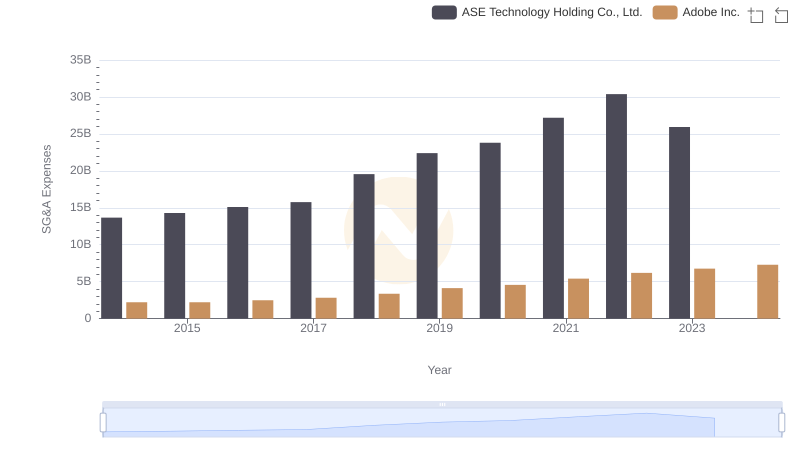
Operational Costs Compared: SG&A Analysis of Adobe Inc. and ASE Technology Holding Co., Ltd.
Comparing SG&A Expenses: Adobe Inc. vs Leidos Holdings, Inc. Trends and Insights