| __timestamp | ASE Technology Holding Co., Ltd. | Adobe Inc. |
|---|---|---|
| Wednesday, January 1, 2014 | 203051000000 | 622080000 |
| Thursday, January 1, 2015 | 233153000000 | 744317000 |
| Friday, January 1, 2016 | 221690000000 | 819908000 |
| Sunday, January 1, 2017 | 237709000000 | 1010491000 |
| Monday, January 1, 2018 | 309929000000 | 1194999000 |
| Tuesday, January 1, 2019 | 348871000000 | 1672720000 |
| Wednesday, January 1, 2020 | 398994000000 | 1722000000 |
| Friday, January 1, 2021 | 459628000000 | 1865000000 |
| Saturday, January 1, 2022 | 535943000000 | 2165000000 |
| Sunday, January 1, 2023 | 490157339000 | 2354000000 |
| Monday, January 1, 2024 | 499722880000 | 2358000000 |
Unlocking the unknown
In the ever-evolving landscape of technology, understanding cost efficiency is crucial. Adobe Inc. and ASE Technology Holding Co., Ltd. offer a fascinating study in contrasts. Over the past decade, ASE Technology's cost of revenue has surged by approximately 140%, peaking in 2022. This reflects their aggressive expansion and scaling efforts. Meanwhile, Adobe's cost of revenue has grown steadily, increasing by around 280% since 2014, showcasing their strategic investments in innovation and market expansion.
From 2014 to 2023, ASE Technology's cost of revenue efficiency highlights their dominance in the semiconductor industry, with a notable peak in 2022. Adobe, on the other hand, has consistently optimized its cost structure, with a significant rise in 2023, indicating robust growth in digital media and marketing solutions.
While 2024 data for ASE Technology is unavailable, Adobe's continued upward trend suggests sustained efficiency improvements.
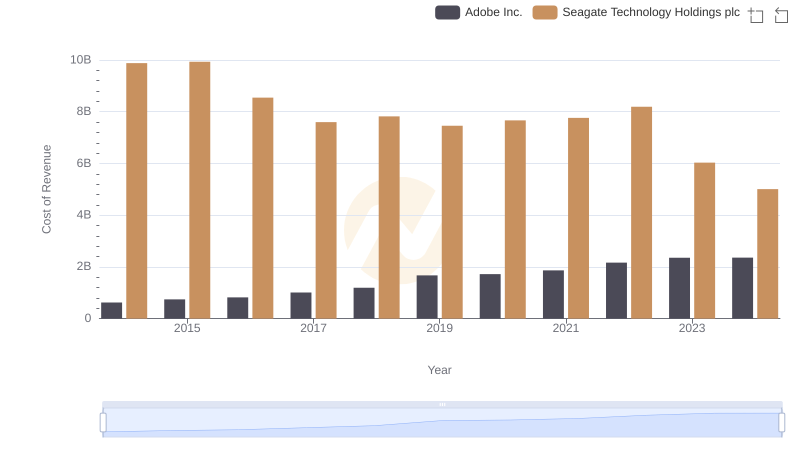
Cost of Revenue: Key Insights for Adobe Inc. and Seagate Technology Holdings plc
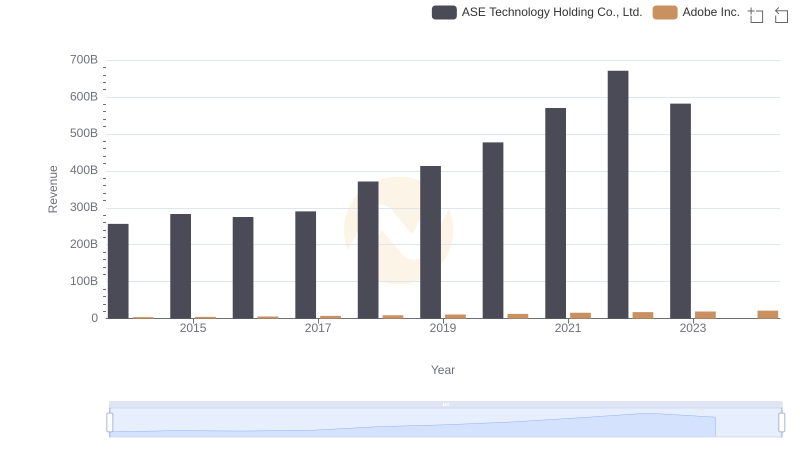
Revenue Insights: Adobe Inc. and ASE Technology Holding Co., Ltd. Performance Compared
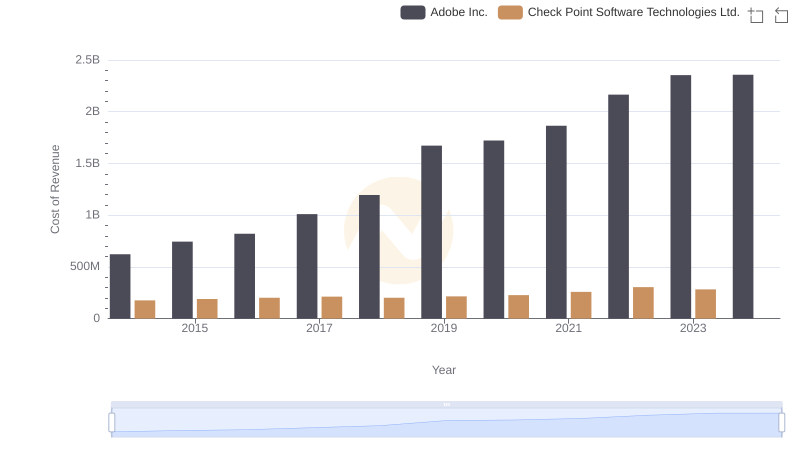
Cost Insights: Breaking Down Adobe Inc. and Check Point Software Technologies Ltd.'s Expenses
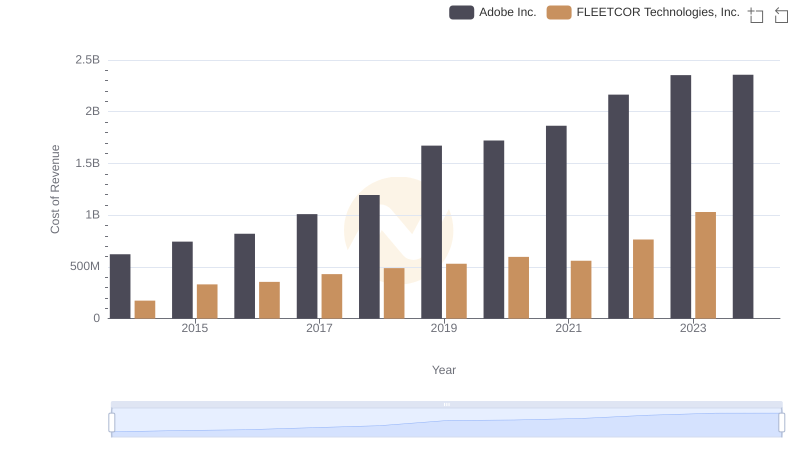
Adobe Inc. vs FLEETCOR Technologies, Inc.: Efficiency in Cost of Revenue Explored
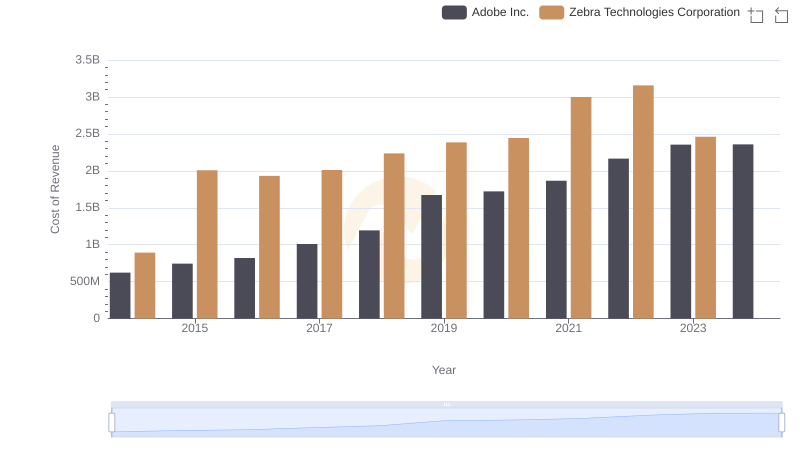
Comparing Cost of Revenue Efficiency: Adobe Inc. vs Zebra Technologies Corporation

Cost Insights: Breaking Down Adobe Inc. and Pure Storage, Inc.'s Expenses
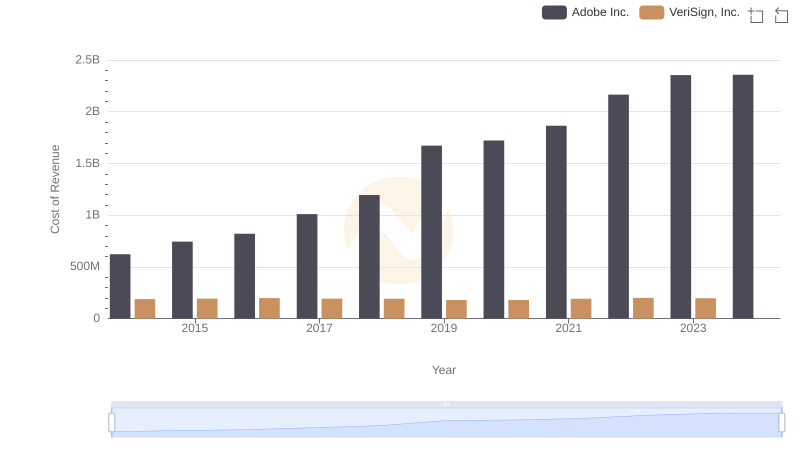
Cost Insights: Breaking Down Adobe Inc. and VeriSign, Inc.'s Expenses
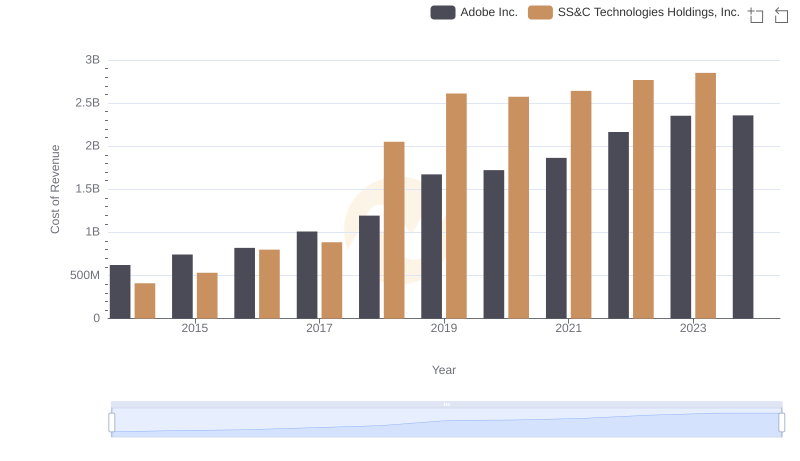
Comparing Cost of Revenue Efficiency: Adobe Inc. vs SS&C Technologies Holdings, Inc.
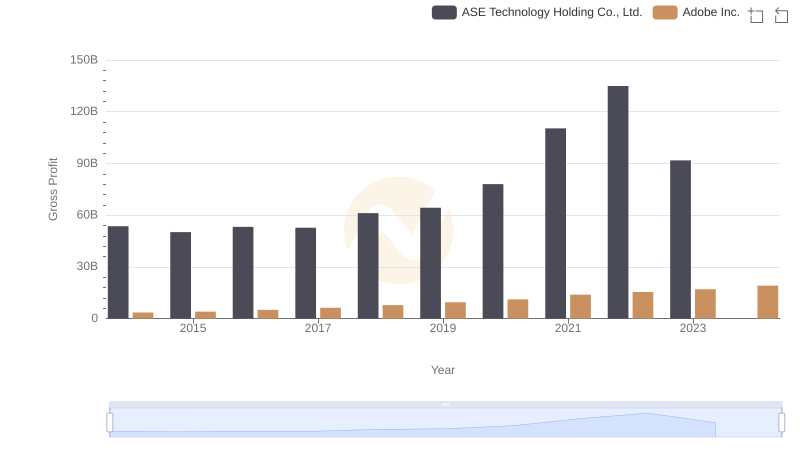
Adobe Inc. vs ASE Technology Holding Co., Ltd.: A Gross Profit Performance Breakdown
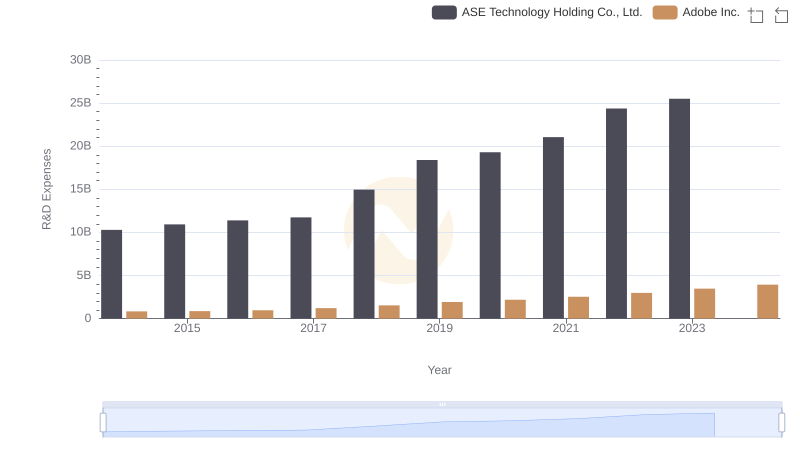
Research and Development Investment: Adobe Inc. vs ASE Technology Holding Co., Ltd.
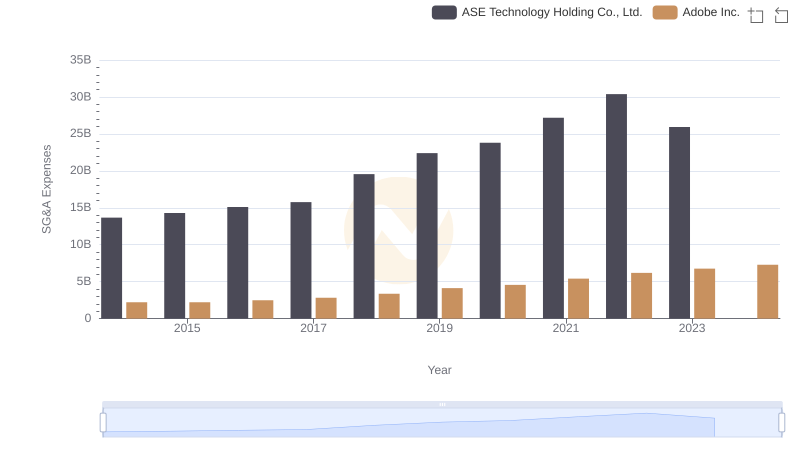
Operational Costs Compared: SG&A Analysis of Adobe Inc. and ASE Technology Holding Co., Ltd.
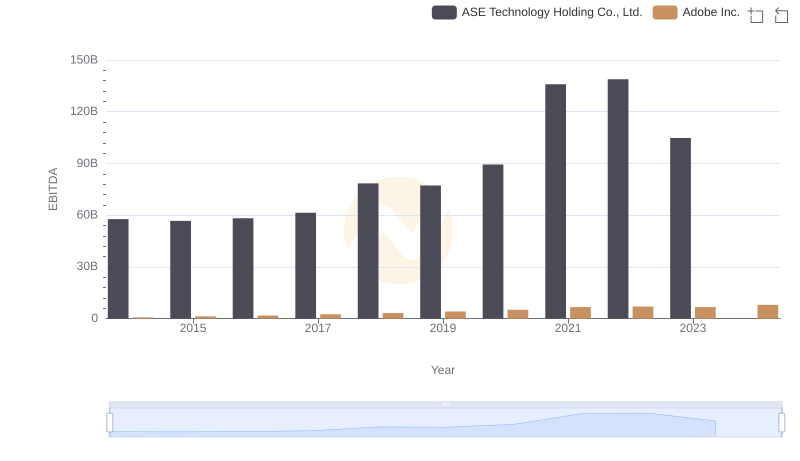
EBITDA Metrics Evaluated: Adobe Inc. vs ASE Technology Holding Co., Ltd.