| __timestamp | ASE Technology Holding Co., Ltd. | Adobe Inc. |
|---|---|---|
| Wednesday, January 1, 2014 | 53540000000 | 3524985000 |
| Thursday, January 1, 2015 | 50149000000 | 4051194000 |
| Friday, January 1, 2016 | 53194000000 | 5034522000 |
| Sunday, January 1, 2017 | 52732000000 | 6291014000 |
| Monday, January 1, 2018 | 61163000000 | 7835009000 |
| Tuesday, January 1, 2019 | 64311000000 | 9498577000 |
| Wednesday, January 1, 2020 | 77984000000 | 11146000000 |
| Friday, January 1, 2021 | 110369000000 | 13920000000 |
| Saturday, January 1, 2022 | 134930000000 | 15441000000 |
| Sunday, January 1, 2023 | 91757132000 | 17055000000 |
| Monday, January 1, 2024 | 95687183000 | 19147000000 |
Unveiling the hidden dimensions of data
In the ever-evolving landscape of global business, Adobe Inc. and ASE Technology Holding Co., Ltd. stand as titans in their respective fields. Over the past decade, these companies have showcased remarkable growth in gross profit, reflecting their strategic prowess and market adaptability.
From 2014 to 2023, ASE Technology's gross profit surged by approximately 72%, peaking in 2022. This growth underscores its dominance in the semiconductor industry, driven by increasing demand for advanced technology solutions. Meanwhile, Adobe Inc., a leader in digital media and marketing solutions, experienced a consistent upward trajectory, with a notable 384% increase in gross profit from 2014 to 2023.
While ASE Technology faced a dip in 2023, Adobe continued its ascent, highlighting its resilience and innovation. As we look to the future, these trends offer valuable insights into the dynamic interplay of technology and creativity in shaping global markets.
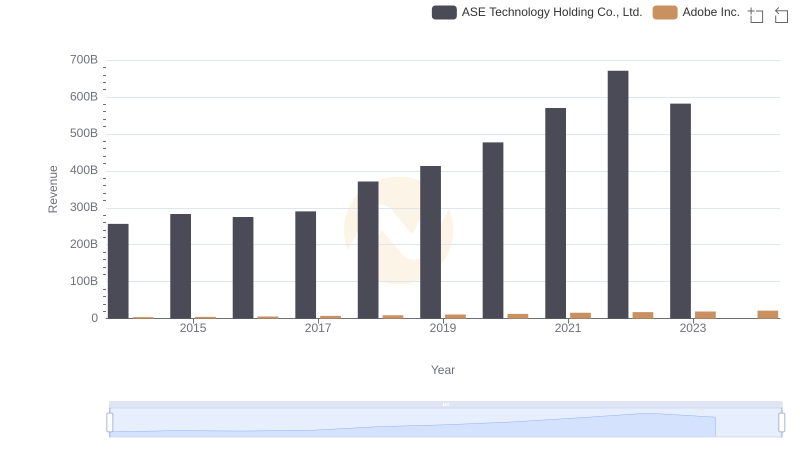
Revenue Insights: Adobe Inc. and ASE Technology Holding Co., Ltd. Performance Compared
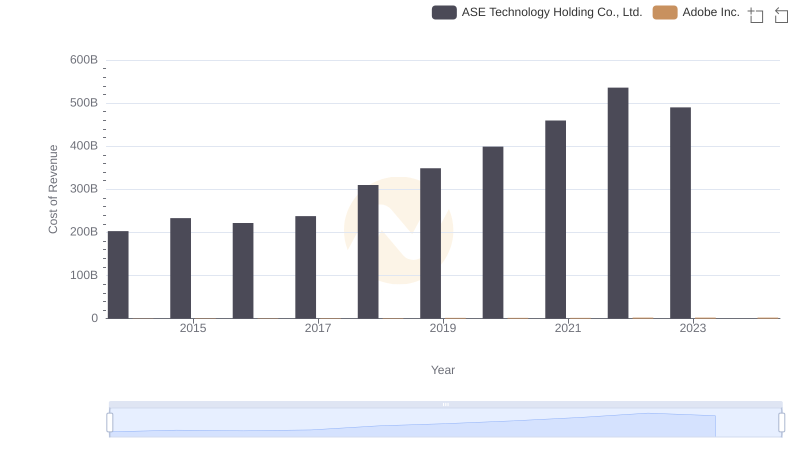
Comparing Cost of Revenue Efficiency: Adobe Inc. vs ASE Technology Holding Co., Ltd.
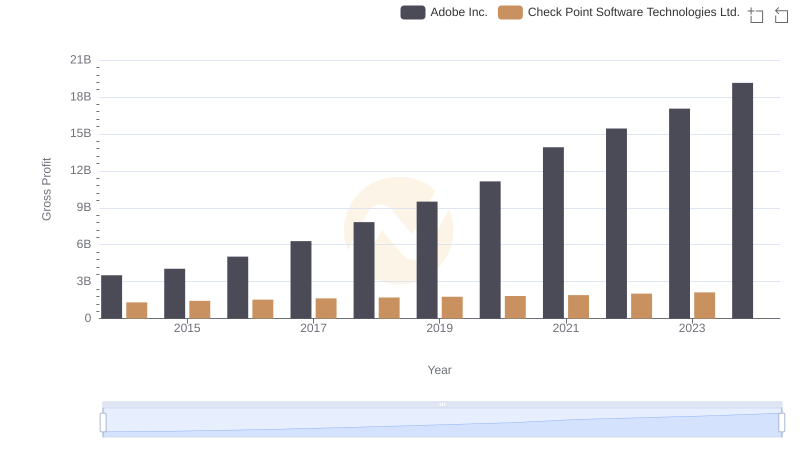
Adobe Inc. vs Check Point Software Technologies Ltd.: A Gross Profit Performance Breakdown
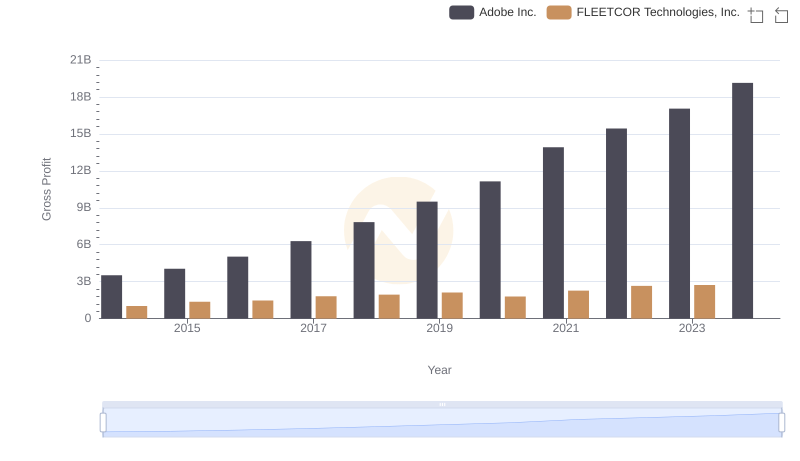
Gross Profit Trends Compared: Adobe Inc. vs FLEETCOR Technologies, Inc.
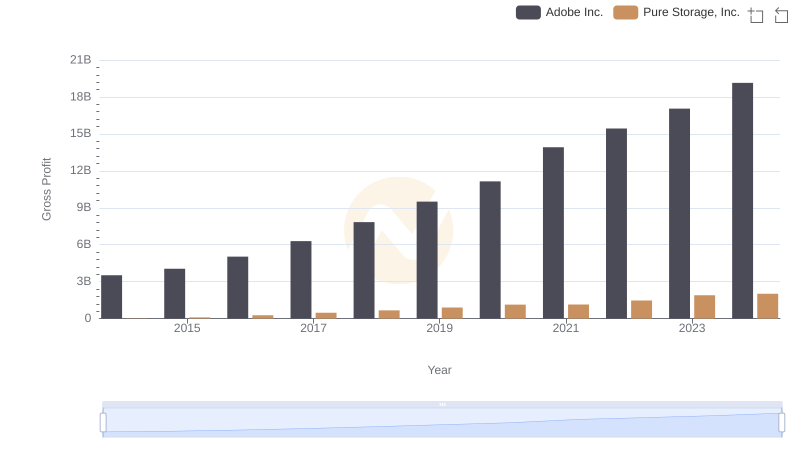
Gross Profit Comparison: Adobe Inc. and Pure Storage, Inc. Trends
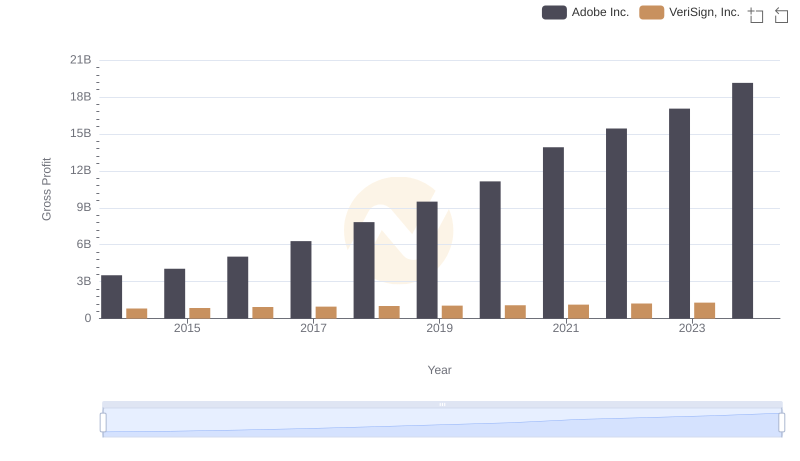
Gross Profit Trends Compared: Adobe Inc. vs VeriSign, Inc.

Gross Profit Analysis: Comparing Adobe Inc. and Zebra Technologies Corporation

Key Insights on Gross Profit: Adobe Inc. vs SS&C Technologies Holdings, Inc.
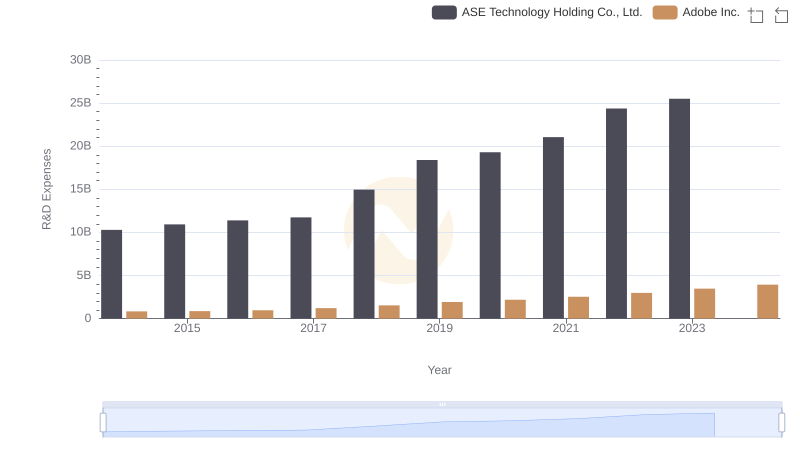
Research and Development Investment: Adobe Inc. vs ASE Technology Holding Co., Ltd.
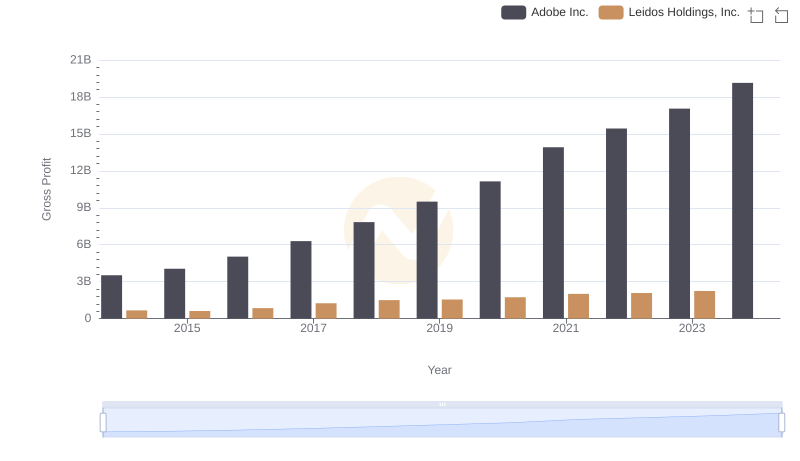
Who Generates Higher Gross Profit? Adobe Inc. or Leidos Holdings, Inc.
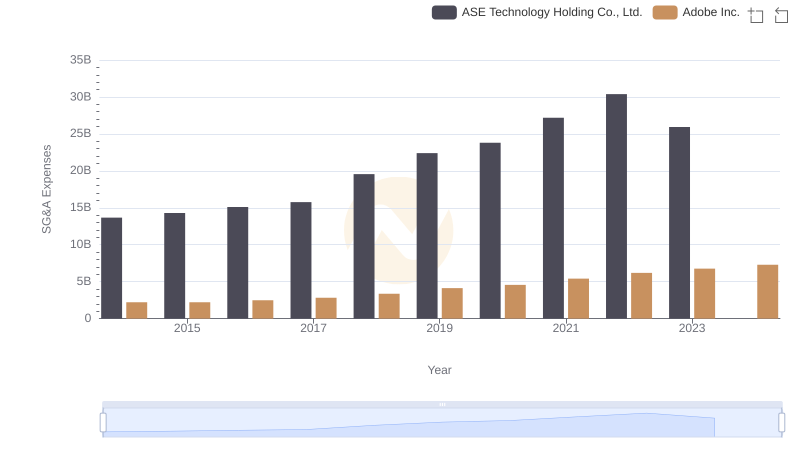
Operational Costs Compared: SG&A Analysis of Adobe Inc. and ASE Technology Holding Co., Ltd.
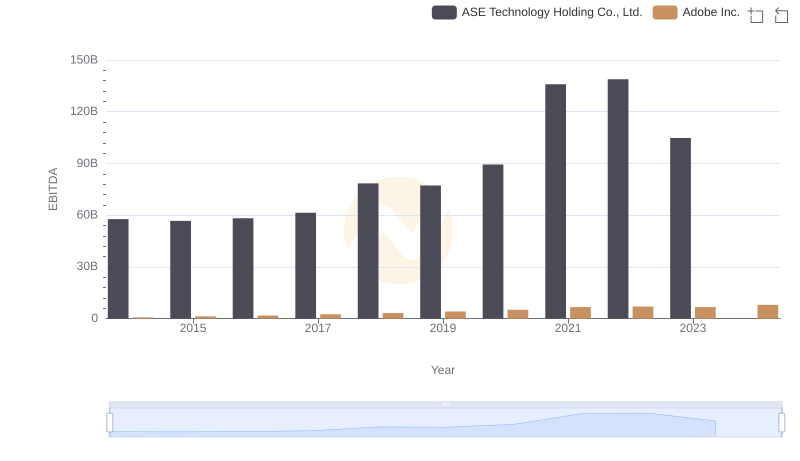
EBITDA Metrics Evaluated: Adobe Inc. vs ASE Technology Holding Co., Ltd.