| __timestamp | Adobe Inc. | Check Point Software Technologies Ltd. |
|---|---|---|
| Wednesday, January 1, 2014 | 2215140000 | 384921000 |
| Thursday, January 1, 2015 | 2215161000 | 451785000 |
| Friday, January 1, 2016 | 2487907000 | 508656000 |
| Sunday, January 1, 2017 | 2822298000 | 525392000 |
| Monday, January 1, 2018 | 3365727000 | 589799000 |
| Tuesday, January 1, 2019 | 4124984000 | 658400000 |
| Wednesday, January 1, 2020 | 4559000000 | 681400000 |
| Friday, January 1, 2021 | 5406000000 | 708500000 |
| Saturday, January 1, 2022 | 6187000000 | 791300000 |
| Sunday, January 1, 2023 | 6764000000 | 864100000 |
| Monday, January 1, 2024 | 7293000000 |
Unleashing insights
In the ever-evolving tech landscape, understanding financial strategies is crucial. Adobe Inc. and Check Point Software Technologies Ltd. offer a fascinating study in contrasts when it comes to Selling, General, and Administrative (SG&A) expenses. Over the past decade, Adobe's SG&A expenses have surged by over 230%, reflecting its aggressive growth and expansion strategies. In 2014, Adobe's SG&A expenses were approximately 2.2 billion, but by 2023, they had escalated to nearly 6.8 billion. This upward trend underscores Adobe's commitment to innovation and market leadership.
Conversely, Check Point Software's SG&A expenses have grown at a more modest pace, increasing by about 125% from 2014 to 2023. This indicates a more conservative approach, focusing on steady growth and cost management. Notably, data for 2024 is missing for Check Point, suggesting a potential shift or anomaly in their financial reporting. These insights reveal the diverse strategies employed by tech giants in navigating competitive markets.
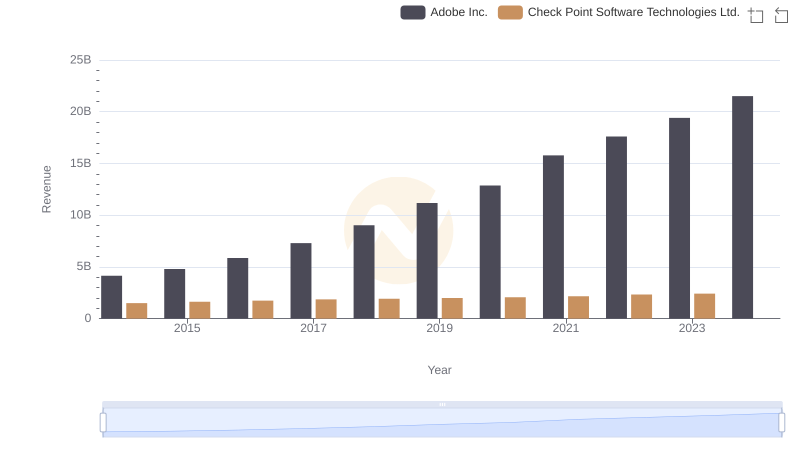
Adobe Inc. and Check Point Software Technologies Ltd.: A Comprehensive Revenue Analysis
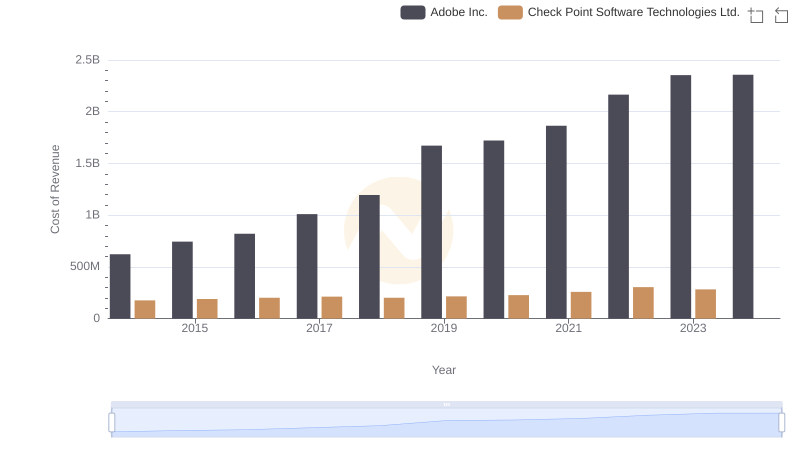
Cost Insights: Breaking Down Adobe Inc. and Check Point Software Technologies Ltd.'s Expenses

Adobe Inc. vs Check Point Software Technologies Ltd.: A Gross Profit Performance Breakdown
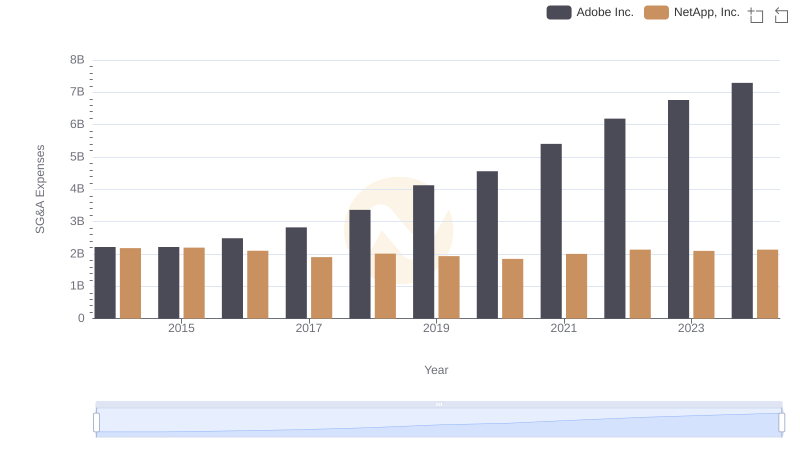
SG&A Efficiency Analysis: Comparing Adobe Inc. and NetApp, Inc.
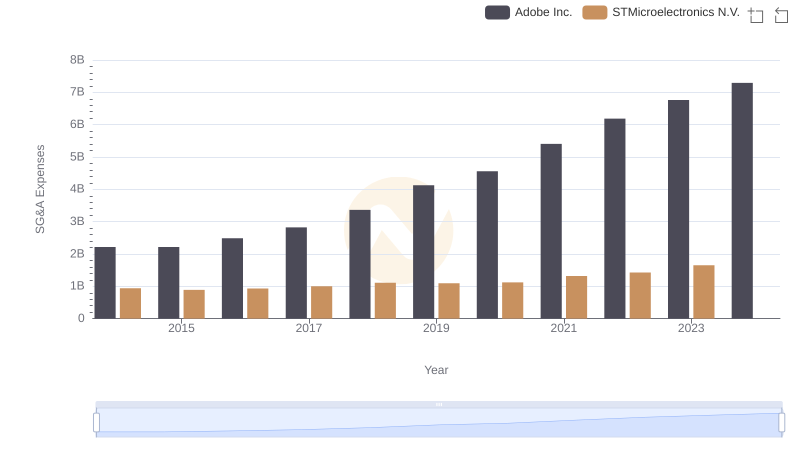
SG&A Efficiency Analysis: Comparing Adobe Inc. and STMicroelectronics N.V.
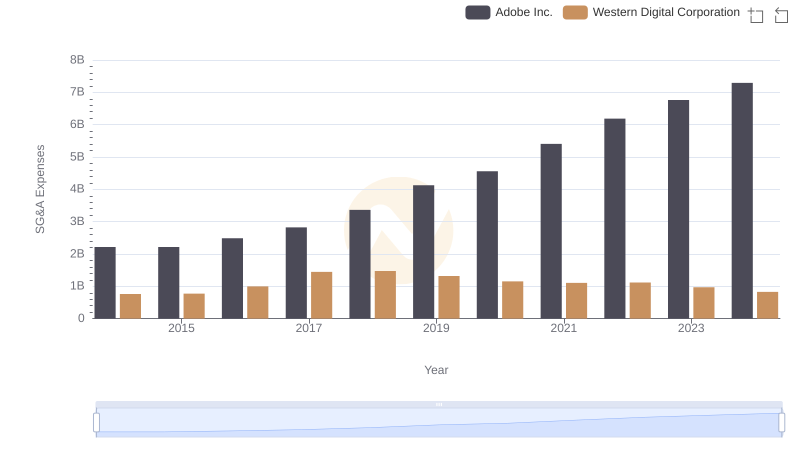
Adobe Inc. vs Western Digital Corporation: SG&A Expense Trends
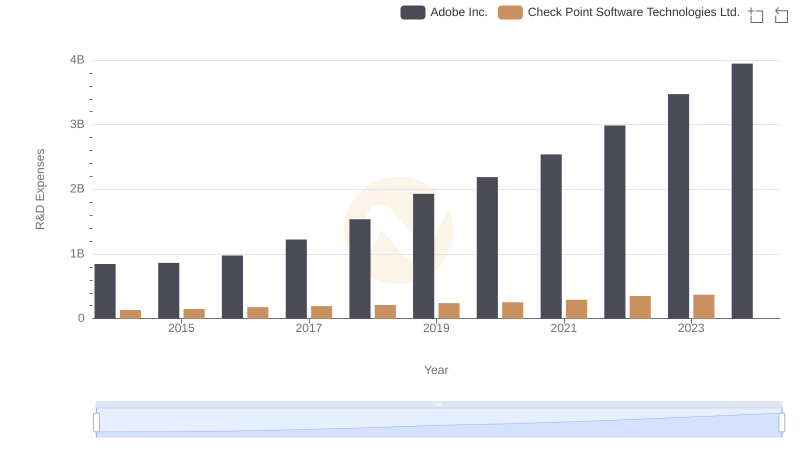
Research and Development Expenses Breakdown: Adobe Inc. vs Check Point Software Technologies Ltd.
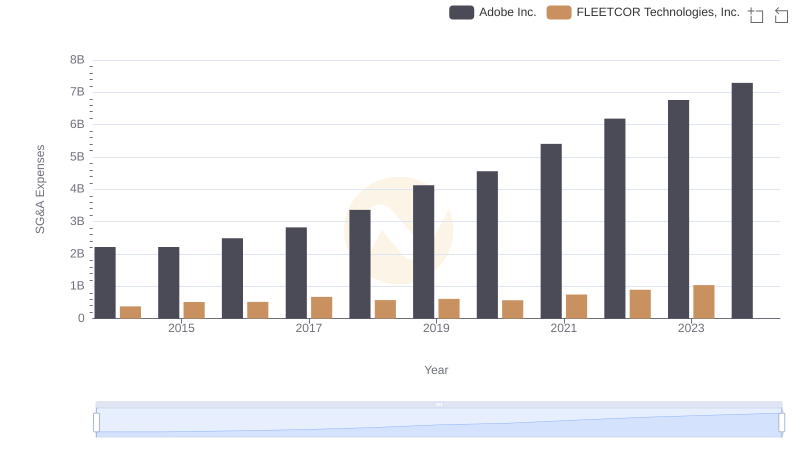
Adobe Inc. or FLEETCOR Technologies, Inc.: Who Manages SG&A Costs Better?
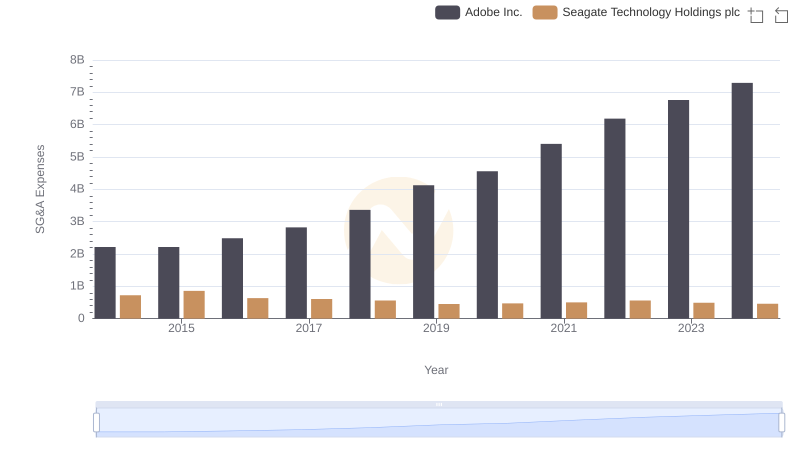
Operational Costs Compared: SG&A Analysis of Adobe Inc. and Seagate Technology Holdings plc
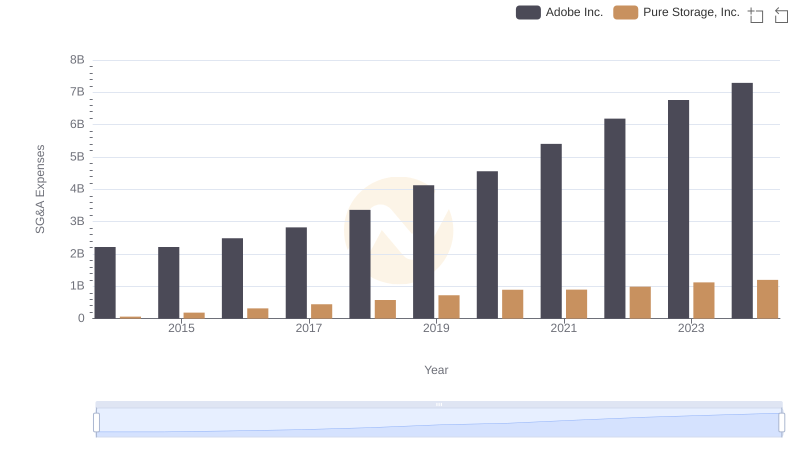
Comparing SG&A Expenses: Adobe Inc. vs Pure Storage, Inc. Trends and Insights
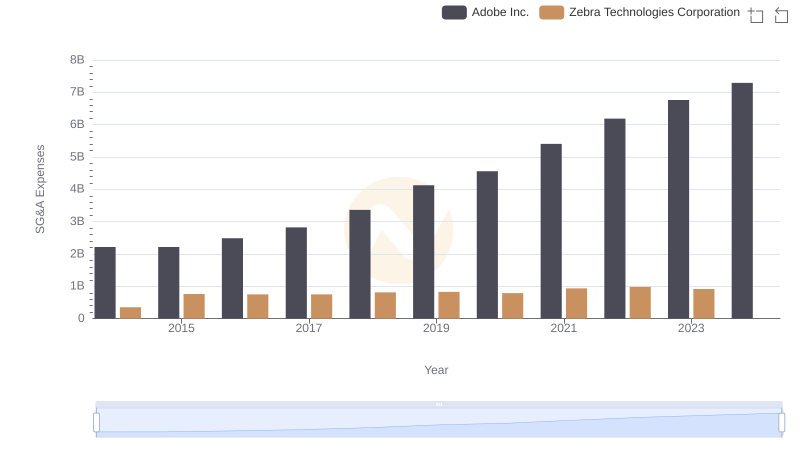
Comparing SG&A Expenses: Adobe Inc. vs Zebra Technologies Corporation Trends and Insights
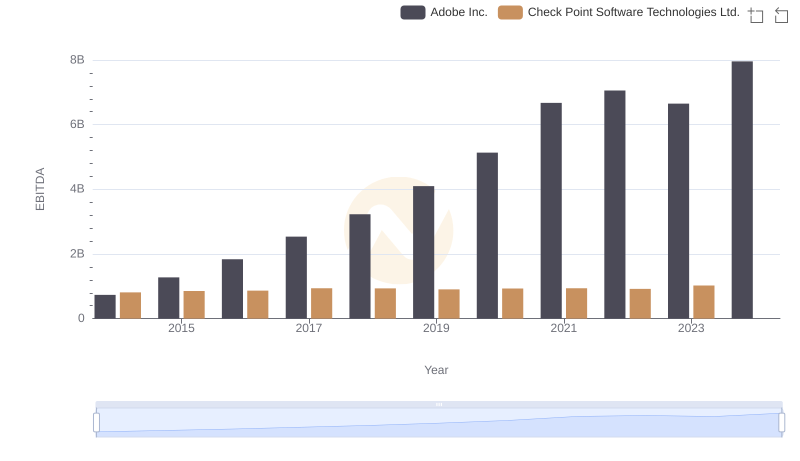
EBITDA Performance Review: Adobe Inc. vs Check Point Software Technologies Ltd.