| __timestamp | ASE Technology Holding Co., Ltd. | Adobe Inc. |
|---|---|---|
| Wednesday, January 1, 2014 | 57728376000 | 734698000 |
| Thursday, January 1, 2015 | 56716330000 | 1277438000 |
| Friday, January 1, 2016 | 58196307000 | 1837115000 |
| Sunday, January 1, 2017 | 61377328000 | 2538040000 |
| Monday, January 1, 2018 | 78432873000 | 3229610000 |
| Tuesday, January 1, 2019 | 77173662000 | 4097396000 |
| Wednesday, January 1, 2020 | 89377502000 | 5133000000 |
| Friday, January 1, 2021 | 135966088000 | 6675000000 |
| Saturday, January 1, 2022 | 138852591000 | 7055000000 |
| Sunday, January 1, 2023 | 104757657000 | 6650000000 |
| Monday, January 1, 2024 | 104735170000 | 7957000000 |
Unveiling the hidden dimensions of data
In the ever-evolving landscape of global technology, understanding financial health is crucial. This analysis delves into the EBITDA performance of two industry giants: Adobe Inc. and ASE Technology Holding Co., Ltd., from 2014 to 2023.
ASE Technology, a leader in semiconductor manufacturing, consistently outperformed Adobe in EBITDA, with a peak in 2022, reaching approximately 138% higher than its 2014 figures. Adobe, a pioneer in digital media solutions, showcased a steady growth trajectory, with its EBITDA increasing by over 960% from 2014 to 2023.
While ASE Technology's EBITDA saw fluctuations, Adobe's growth was more linear, reflecting its strategic expansion in cloud services. Notably, 2023 data for ASE Technology is missing, indicating potential reporting delays or strategic shifts. This comparison highlights the diverse financial strategies and market dynamics influencing these tech titans.
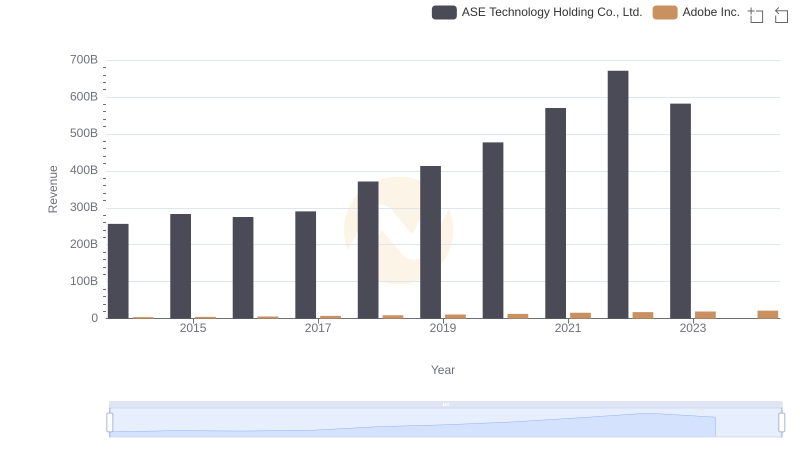
Revenue Insights: Adobe Inc. and ASE Technology Holding Co., Ltd. Performance Compared
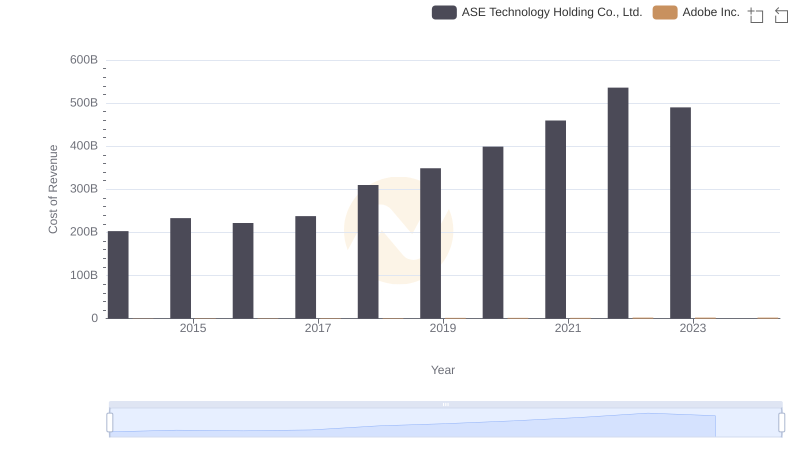
Comparing Cost of Revenue Efficiency: Adobe Inc. vs ASE Technology Holding Co., Ltd.
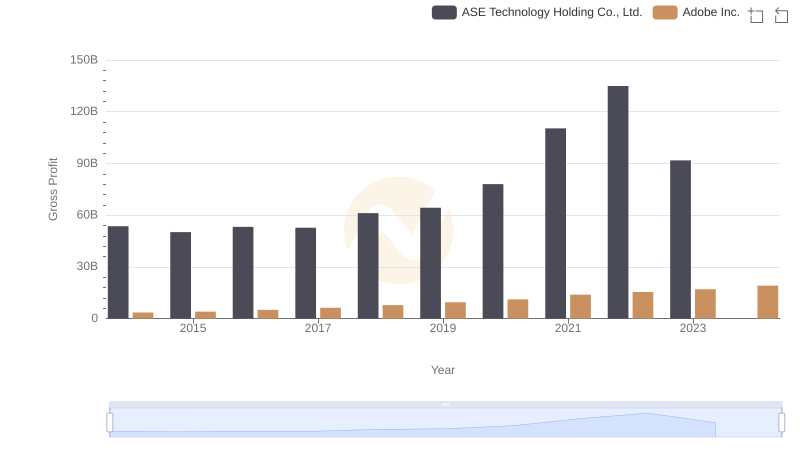
Adobe Inc. vs ASE Technology Holding Co., Ltd.: A Gross Profit Performance Breakdown
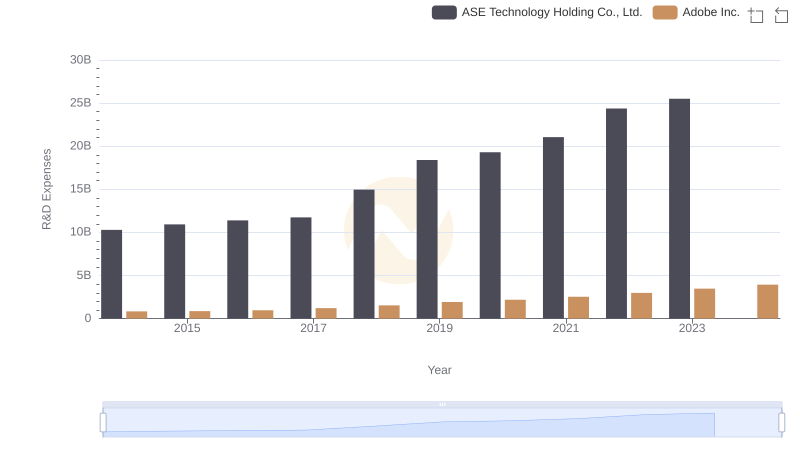
Research and Development Investment: Adobe Inc. vs ASE Technology Holding Co., Ltd.
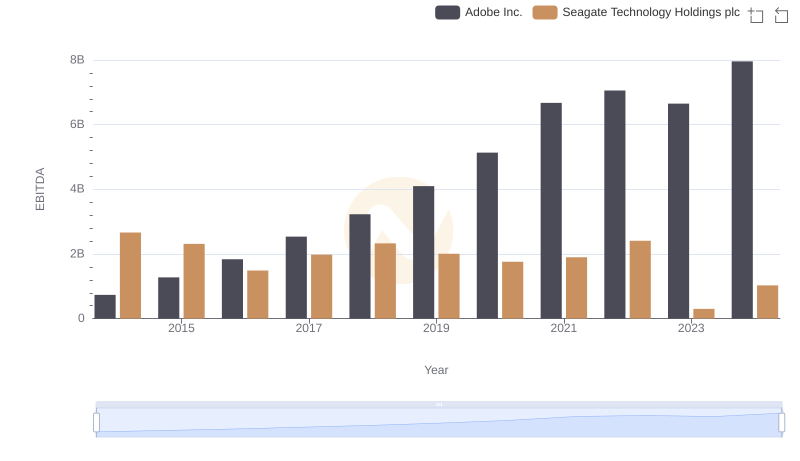
EBITDA Performance Review: Adobe Inc. vs Seagate Technology Holdings plc
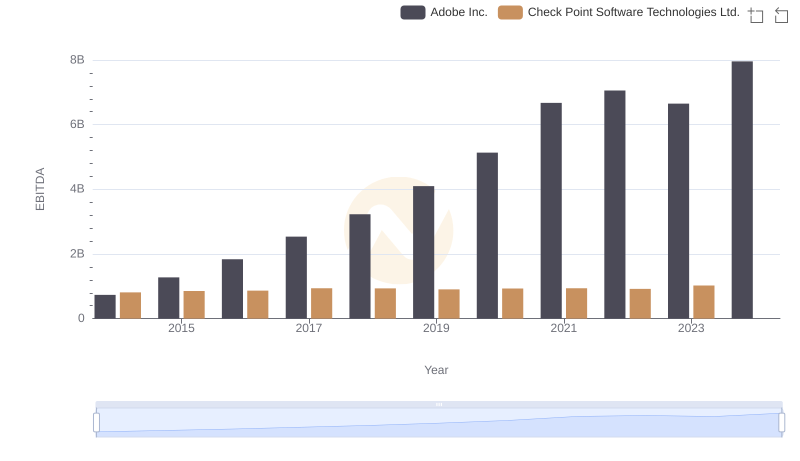
EBITDA Performance Review: Adobe Inc. vs Check Point Software Technologies Ltd.
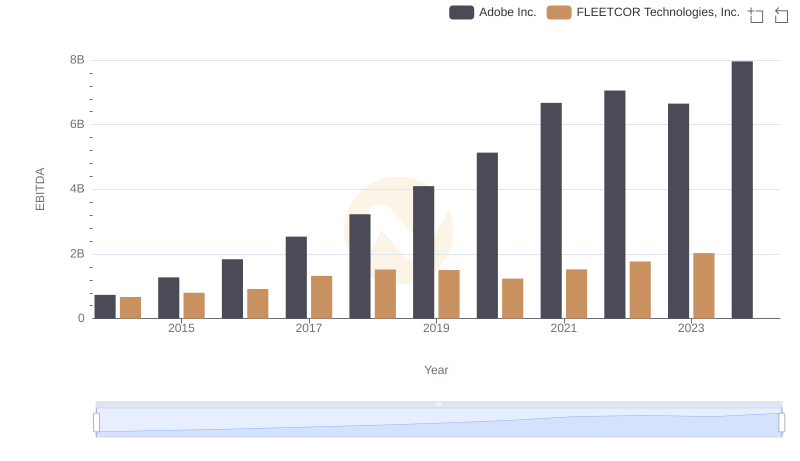
EBITDA Analysis: Evaluating Adobe Inc. Against FLEETCOR Technologies, Inc.
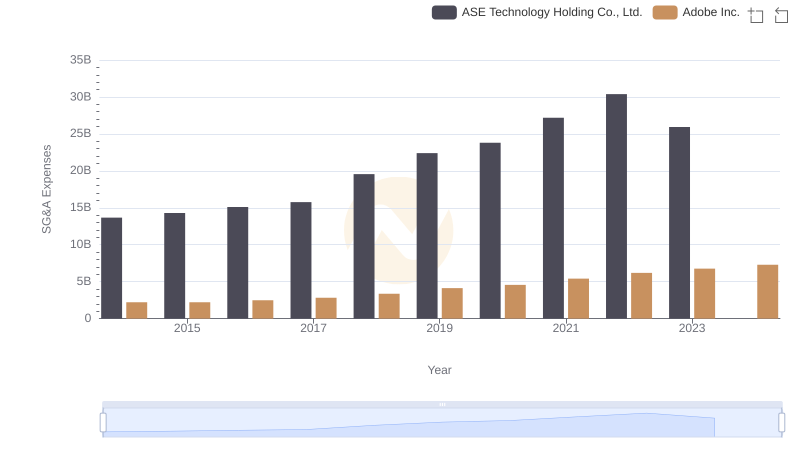
Operational Costs Compared: SG&A Analysis of Adobe Inc. and ASE Technology Holding Co., Ltd.
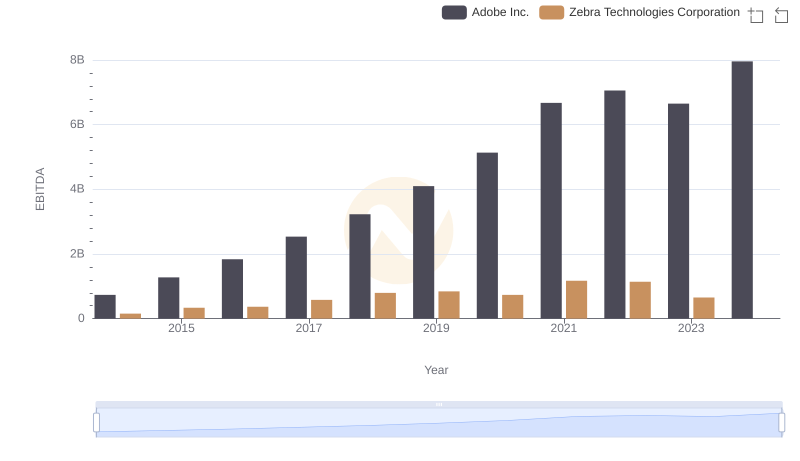
Comparative EBITDA Analysis: Adobe Inc. vs Zebra Technologies Corporation
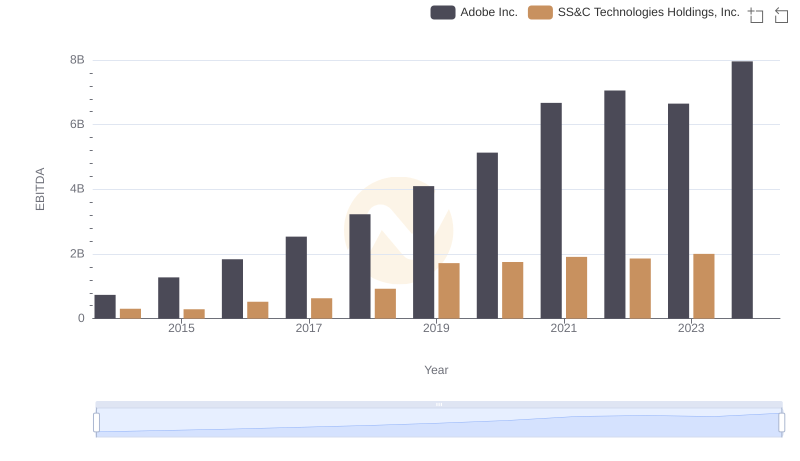
EBITDA Performance Review: Adobe Inc. vs SS&C Technologies Holdings, Inc.
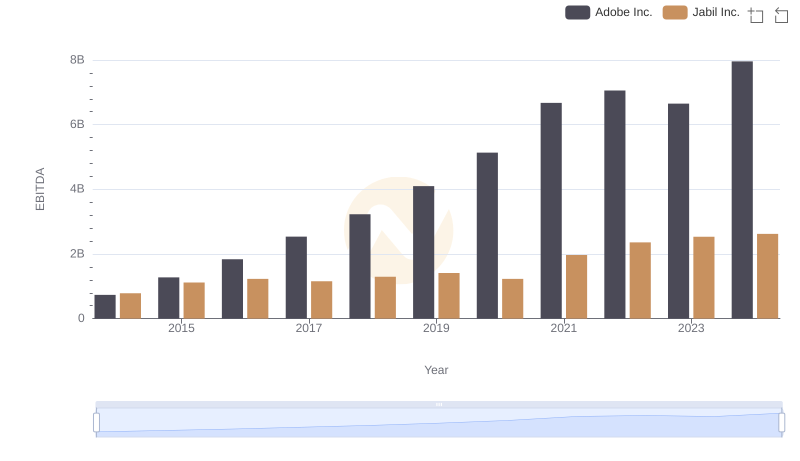
EBITDA Analysis: Evaluating Adobe Inc. Against Jabil Inc.
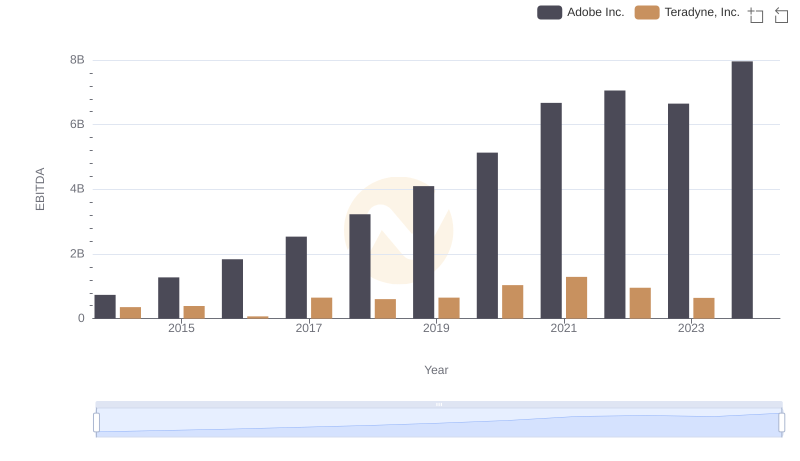
EBITDA Analysis: Evaluating Adobe Inc. Against Teradyne, Inc.