| __timestamp | Adobe Inc. | SS&C Technologies Holdings, Inc. |
|---|---|---|
| Wednesday, January 1, 2014 | 2215140000 | 99471000 |
| Thursday, January 1, 2015 | 2215161000 | 192782000 |
| Friday, January 1, 2016 | 2487907000 | 239563000 |
| Sunday, January 1, 2017 | 2822298000 | 238623000 |
| Monday, January 1, 2018 | 3365727000 | 524900000 |
| Tuesday, January 1, 2019 | 4124984000 | 723100000 |
| Wednesday, January 1, 2020 | 4559000000 | 708600000 |
| Friday, January 1, 2021 | 5406000000 | 752100000 |
| Saturday, January 1, 2022 | 6187000000 | 925100000 |
| Sunday, January 1, 2023 | 6764000000 | 959700000 |
| Monday, January 1, 2024 | 7293000000 | 1002400000 |
Unleashing the power of data
In the ever-evolving landscape of technology, understanding financial trends is crucial. This analysis delves into the Selling, General, and Administrative (SG&A) expenses of Adobe Inc. and SS&C Technologies Holdings, Inc. from 2014 to 2023. Adobe's SG&A expenses have shown a remarkable upward trajectory, growing by approximately 229% over the decade. This reflects Adobe's strategic investments in marketing and administrative capabilities to maintain its competitive edge. In contrast, SS&C Technologies Holdings, Inc. has experienced a more modest increase of around 865%, indicating a steady yet cautious approach to scaling its operations. Notably, the data for 2024 is incomplete, highlighting the dynamic nature of financial reporting. This comparison not only underscores the differing growth strategies of these tech giants but also offers insights into their operational priorities. As the tech industry continues to expand, monitoring such financial metrics will be key to understanding future market dynamics.
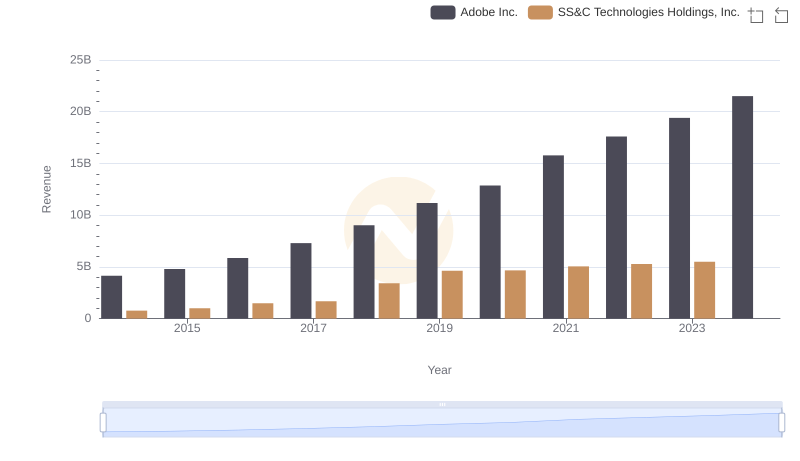
Comparing Revenue Performance: Adobe Inc. or SS&C Technologies Holdings, Inc.?
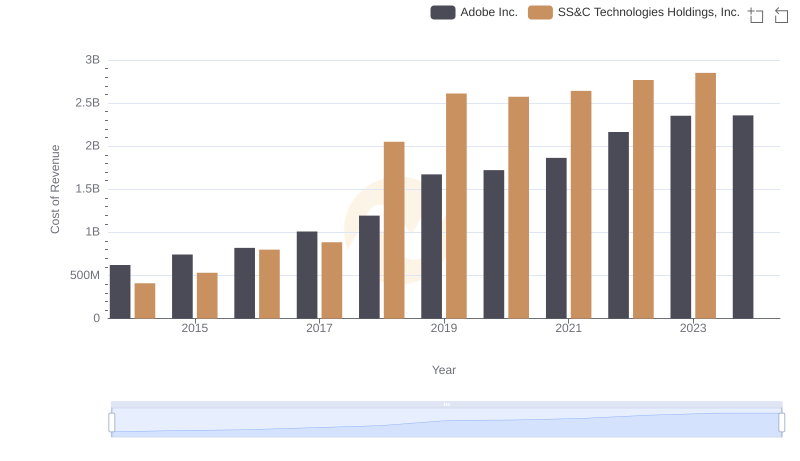
Comparing Cost of Revenue Efficiency: Adobe Inc. vs SS&C Technologies Holdings, Inc.
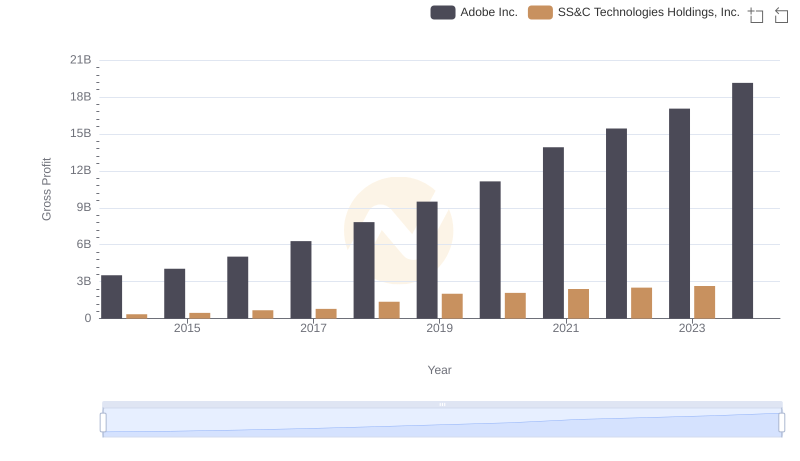
Key Insights on Gross Profit: Adobe Inc. vs SS&C Technologies Holdings, Inc.
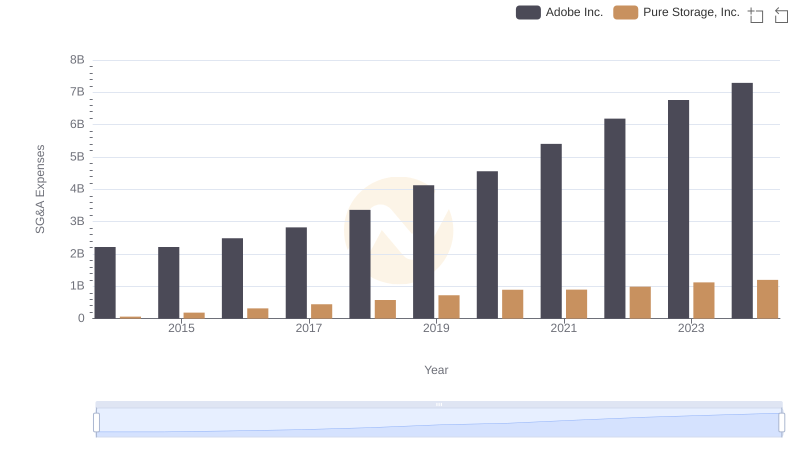
Comparing SG&A Expenses: Adobe Inc. vs Pure Storage, Inc. Trends and Insights
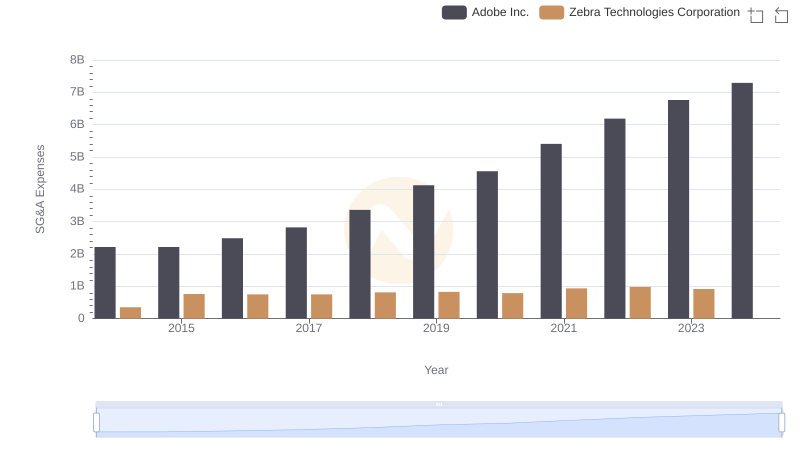
Comparing SG&A Expenses: Adobe Inc. vs Zebra Technologies Corporation Trends and Insights
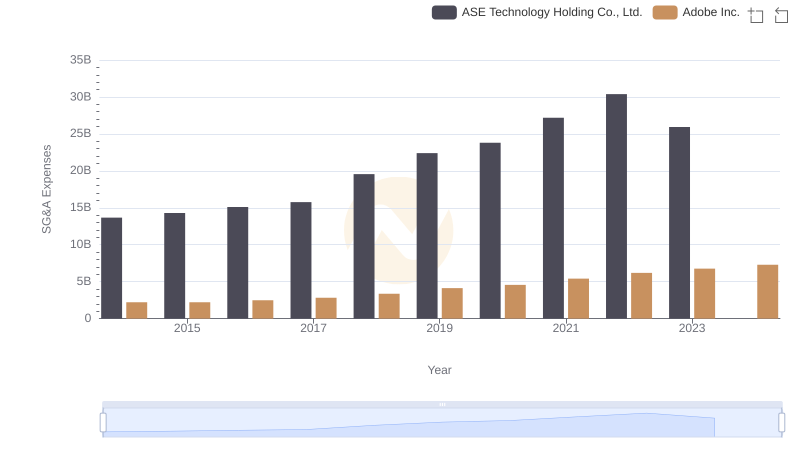
Operational Costs Compared: SG&A Analysis of Adobe Inc. and ASE Technology Holding Co., Ltd.
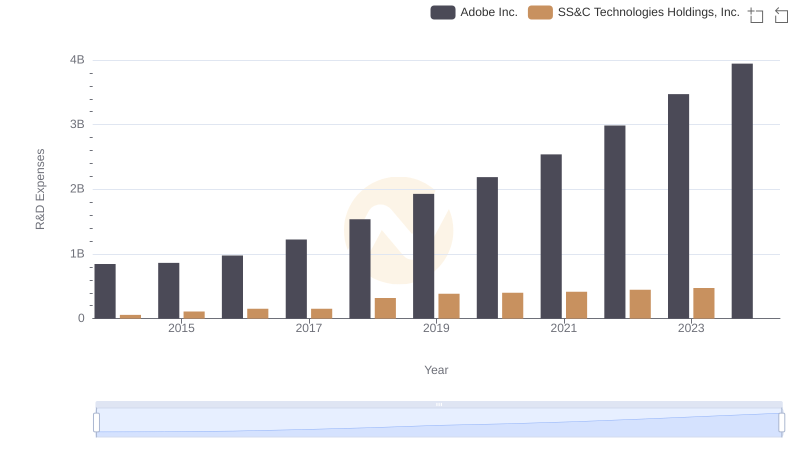
Adobe Inc. or SS&C Technologies Holdings, Inc.: Who Invests More in Innovation?

Comparing SG&A Expenses: Adobe Inc. vs Leidos Holdings, Inc. Trends and Insights
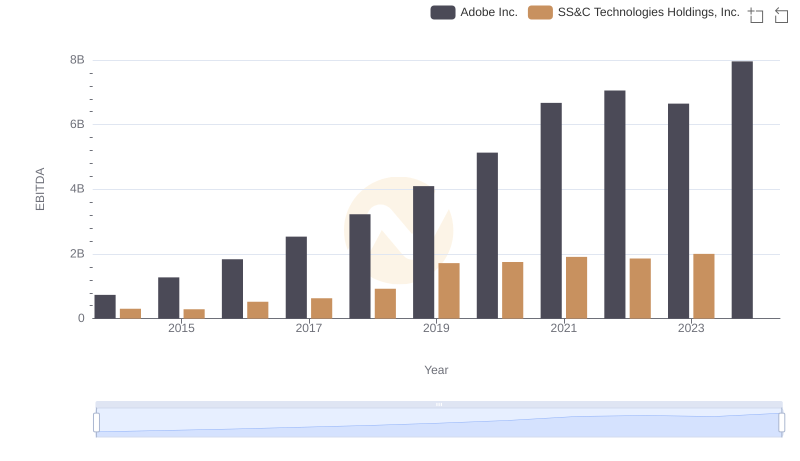
EBITDA Performance Review: Adobe Inc. vs SS&C Technologies Holdings, Inc.
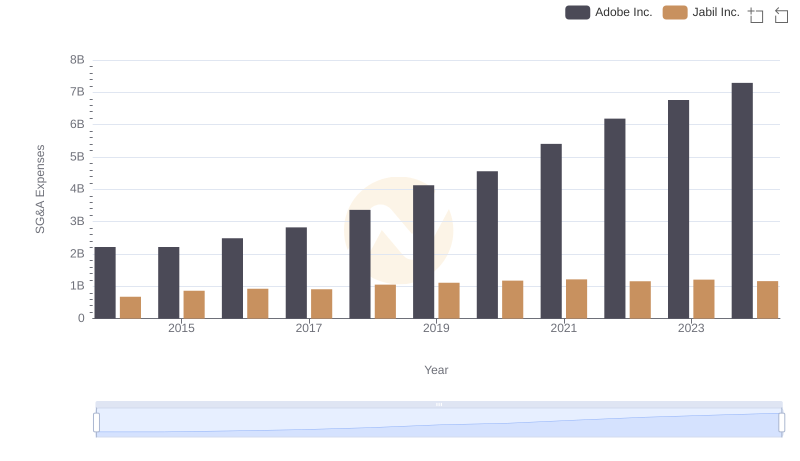
Breaking Down SG&A Expenses: Adobe Inc. vs Jabil Inc.
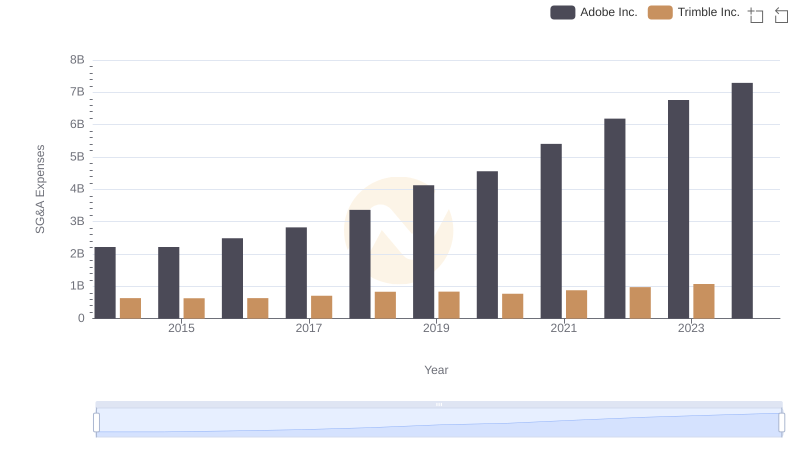
SG&A Efficiency Analysis: Comparing Adobe Inc. and Trimble Inc.
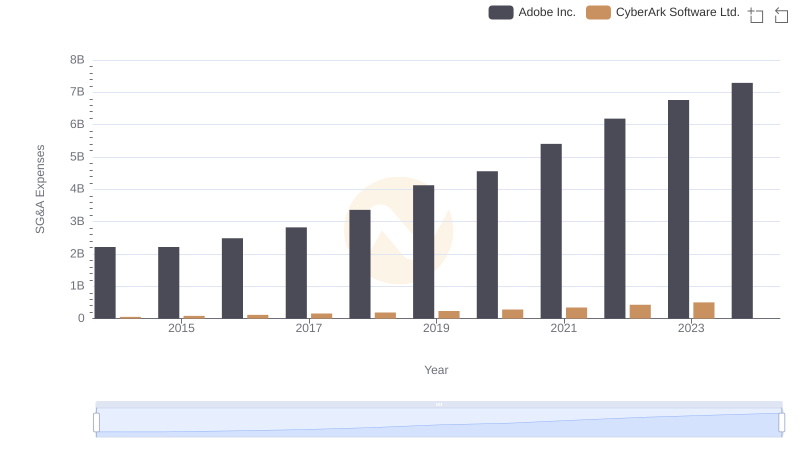
Adobe Inc. or CyberArk Software Ltd.: Who Manages SG&A Costs Better?