| __timestamp | ASE Technology Holding Co., Ltd. | Adobe Inc. |
|---|---|---|
| Wednesday, January 1, 2014 | 10296000000 | 844353000 |
| Thursday, January 1, 2015 | 10928000000 | 862730000 |
| Friday, January 1, 2016 | 11391000000 | 975987000 |
| Sunday, January 1, 2017 | 11747000000 | 1224059000 |
| Monday, January 1, 2018 | 14963000000 | 1537812000 |
| Tuesday, January 1, 2019 | 18396000000 | 1930228000 |
| Wednesday, January 1, 2020 | 19301000000 | 2188000000 |
| Friday, January 1, 2021 | 21053000000 | 2540000000 |
| Saturday, January 1, 2022 | 24370000000 | 2987000000 |
| Sunday, January 1, 2023 | 25499408000 | 3473000000 |
| Monday, January 1, 2024 | 28829912000 | 3944000000 |
Data in motion
In the ever-evolving landscape of technology, research and development (R&D) investments are pivotal. Over the past decade, Adobe Inc. and ASE Technology Holding Co., Ltd. have demonstrated contrasting strategies in their R&D expenditures. From 2014 to 2023, ASE Technology's R&D spending surged by approximately 148%, reflecting its commitment to maintaining a competitive edge in semiconductor manufacturing. In contrast, Adobe Inc. increased its R&D investment by around 311%, underscoring its focus on software innovation and digital media solutions.
While ASE Technology's R&D expenses consistently outpaced Adobe's in absolute terms, Adobe's rapid growth in R&D spending highlights its aggressive pursuit of technological advancements. Notably, 2023 saw Adobe's R&D expenses reach nearly $3.5 billion, a significant leap from $844 million in 2014. This trend underscores the dynamic nature of the tech industry, where strategic investments in R&D can redefine market positions.
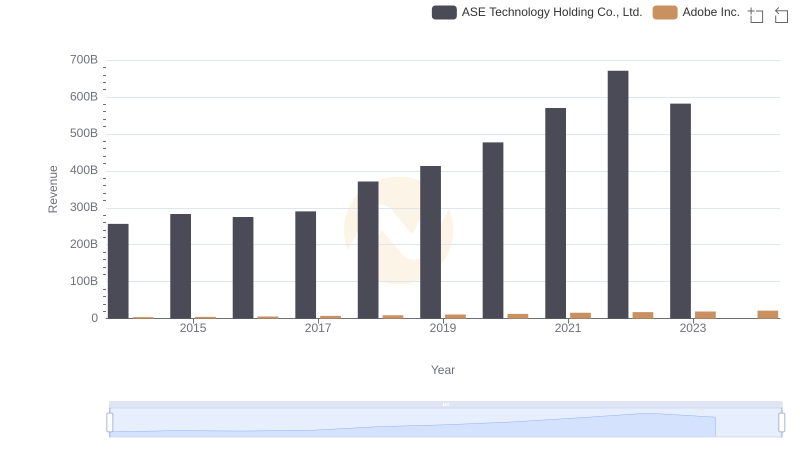
Revenue Insights: Adobe Inc. and ASE Technology Holding Co., Ltd. Performance Compared
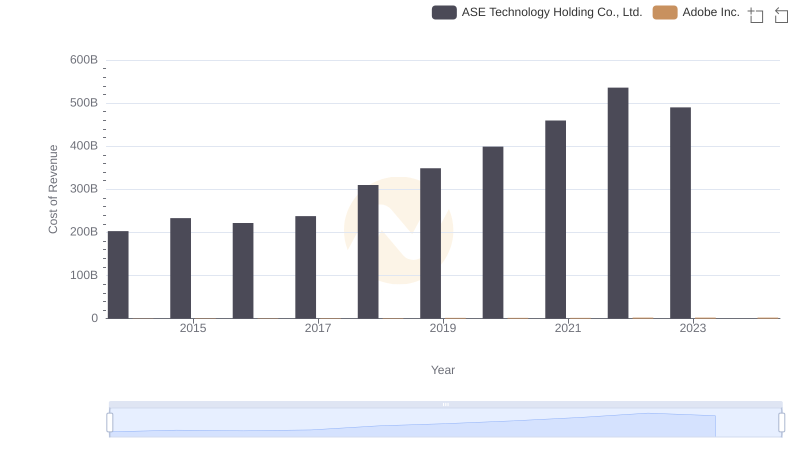
Comparing Cost of Revenue Efficiency: Adobe Inc. vs ASE Technology Holding Co., Ltd.
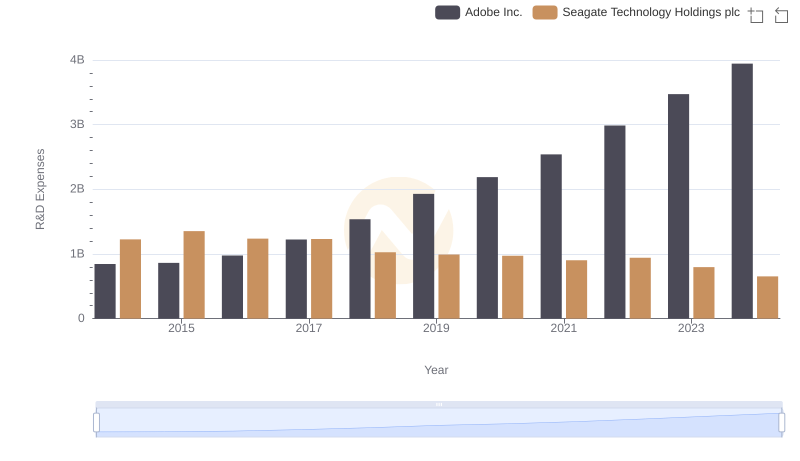
Research and Development Expenses Breakdown: Adobe Inc. vs Seagate Technology Holdings plc
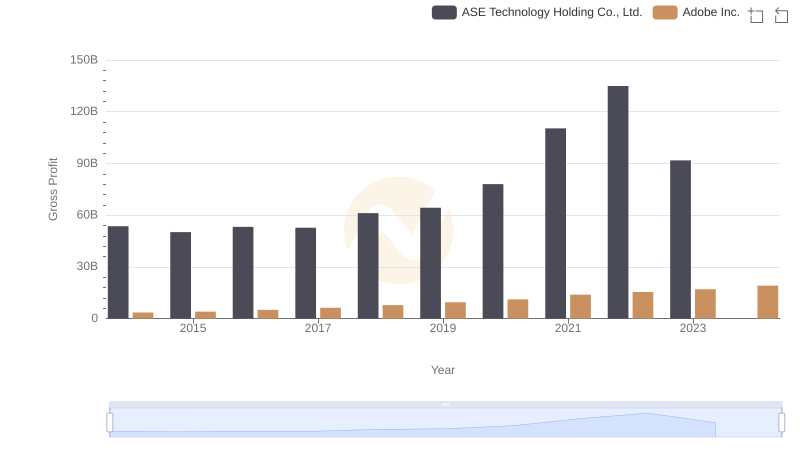
Adobe Inc. vs ASE Technology Holding Co., Ltd.: A Gross Profit Performance Breakdown
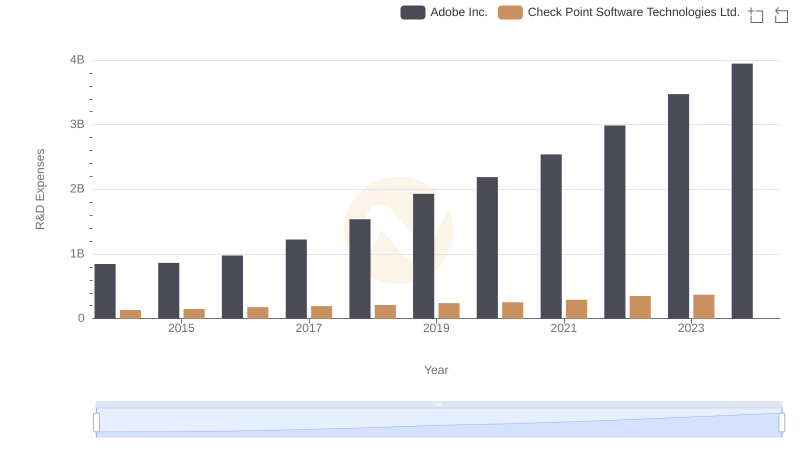
Research and Development Expenses Breakdown: Adobe Inc. vs Check Point Software Technologies Ltd.
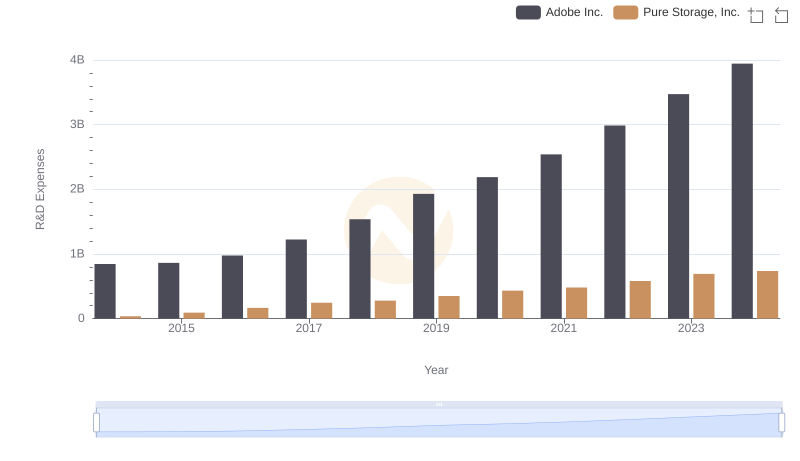
R&D Spending Showdown: Adobe Inc. vs Pure Storage, Inc.

Comparing Innovation Spending: Adobe Inc. and Zebra Technologies Corporation
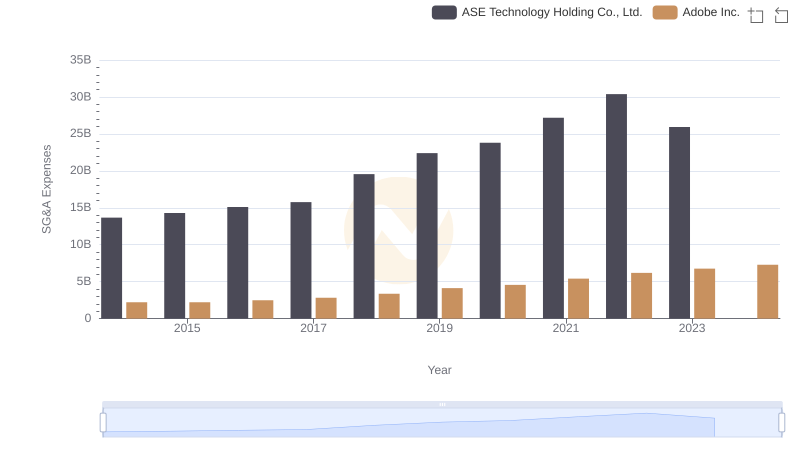
Operational Costs Compared: SG&A Analysis of Adobe Inc. and ASE Technology Holding Co., Ltd.
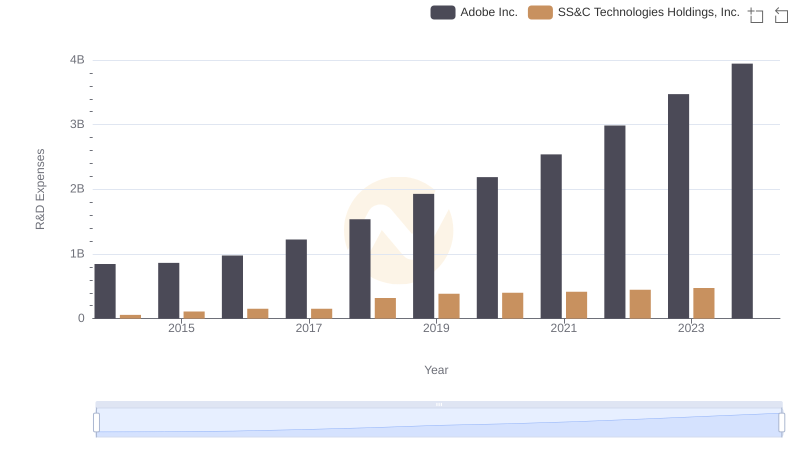
Adobe Inc. or SS&C Technologies Holdings, Inc.: Who Invests More in Innovation?
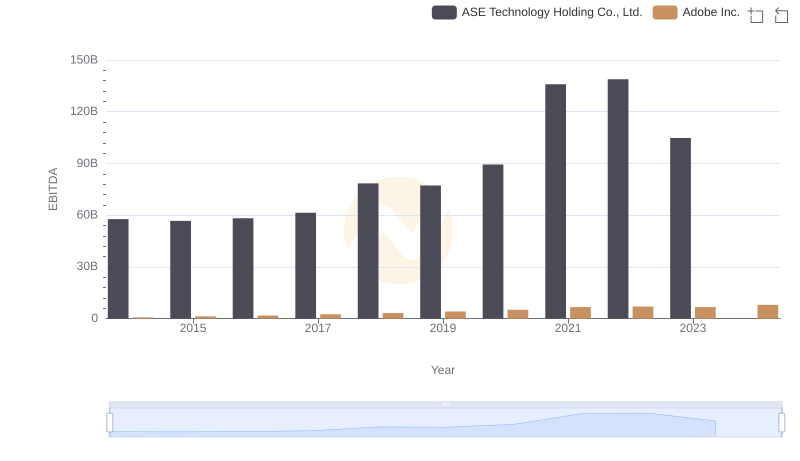
EBITDA Metrics Evaluated: Adobe Inc. vs ASE Technology Holding Co., Ltd.
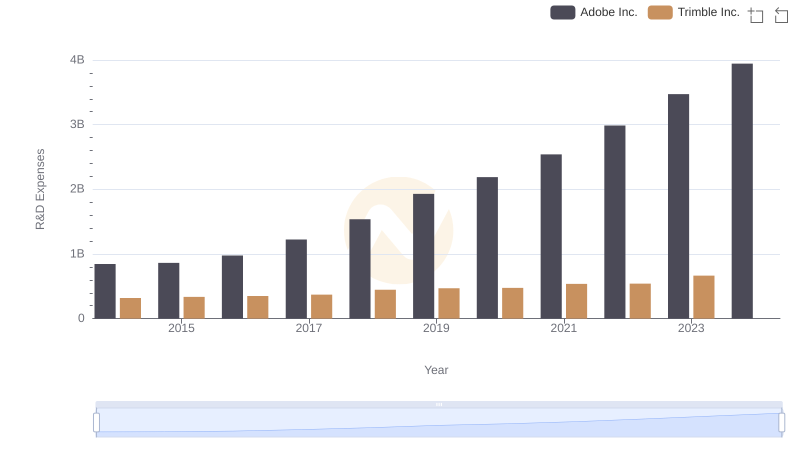
R&D Spending Showdown: Adobe Inc. vs Trimble Inc.
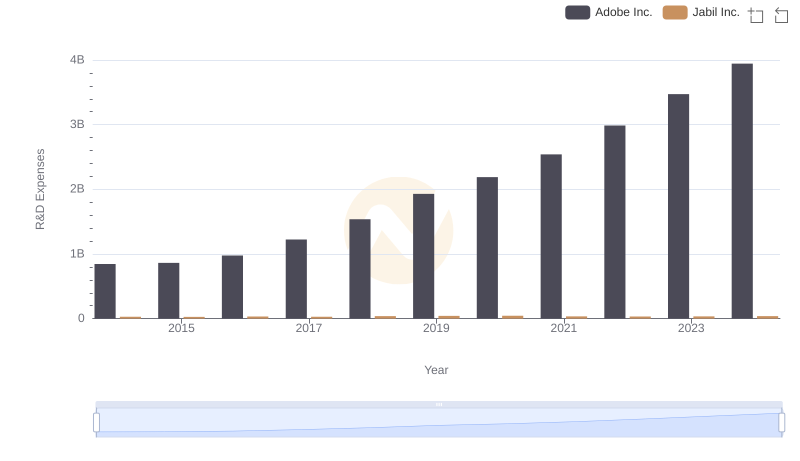
Comparing Innovation Spending: Adobe Inc. and Jabil Inc.