| __timestamp | ASE Technology Holding Co., Ltd. | Adobe Inc. |
|---|---|---|
| Wednesday, January 1, 2014 | 256591000000 | 4147065000 |
| Thursday, January 1, 2015 | 283302000000 | 4795511000 |
| Friday, January 1, 2016 | 274884000000 | 5854430000 |
| Sunday, January 1, 2017 | 290441000000 | 7301505000 |
| Monday, January 1, 2018 | 371092000000 | 9030008000 |
| Tuesday, January 1, 2019 | 413182000000 | 11171297000 |
| Wednesday, January 1, 2020 | 476978000000 | 12868000000 |
| Friday, January 1, 2021 | 569997000000 | 15785000000 |
| Saturday, January 1, 2022 | 670873000000 | 17606000000 |
| Sunday, January 1, 2023 | 581914471000 | 19409000000 |
| Monday, January 1, 2024 | 595410063000 | 21505000000 |
Unleashing insights
In the ever-evolving landscape of technology, Adobe Inc. and ASE Technology Holding Co., Ltd. have carved distinct paths. Over the past decade, Adobe's revenue has surged by over 400%, reflecting its strategic pivot to cloud-based solutions. From 2014 to 2023, Adobe's revenue grew from approximately $4.1 billion to nearly $19.4 billion, showcasing its adaptability and innovation.
Conversely, ASE Technology, a leader in semiconductor manufacturing, experienced a steady revenue increase of about 127% from 2014 to 2022, peaking at $670 billion. However, 2023 saw a dip, highlighting the volatile nature of the semiconductor industry.
While Adobe's growth trajectory remains upward, ASE's recent decline underscores the challenges faced by hardware-centric companies. As we look to the future, the missing data for 2024 invites speculation on how these industry titans will navigate the ever-changing tech landscape.
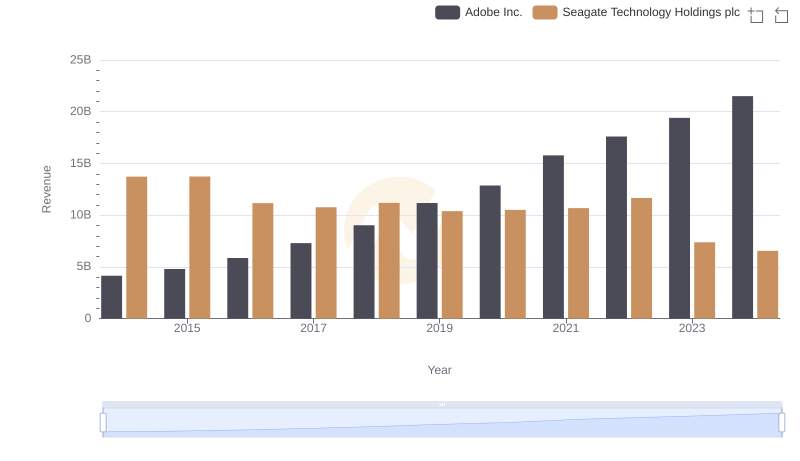
Revenue Showdown: Adobe Inc. vs Seagate Technology Holdings plc
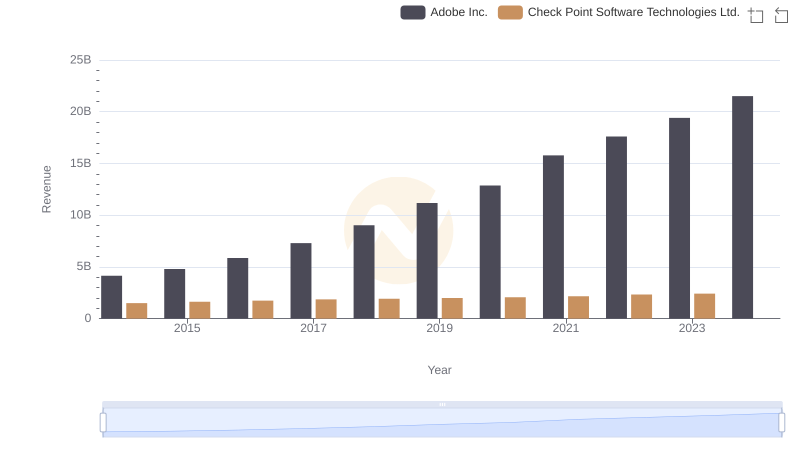
Adobe Inc. and Check Point Software Technologies Ltd.: A Comprehensive Revenue Analysis
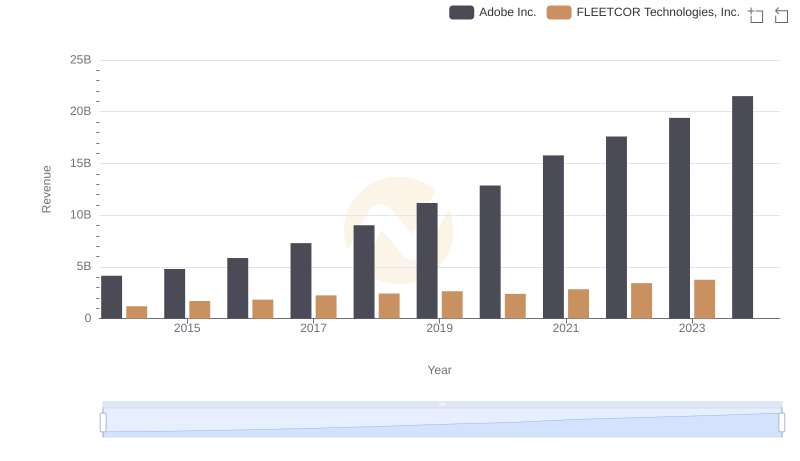
Revenue Showdown: Adobe Inc. vs FLEETCOR Technologies, Inc.
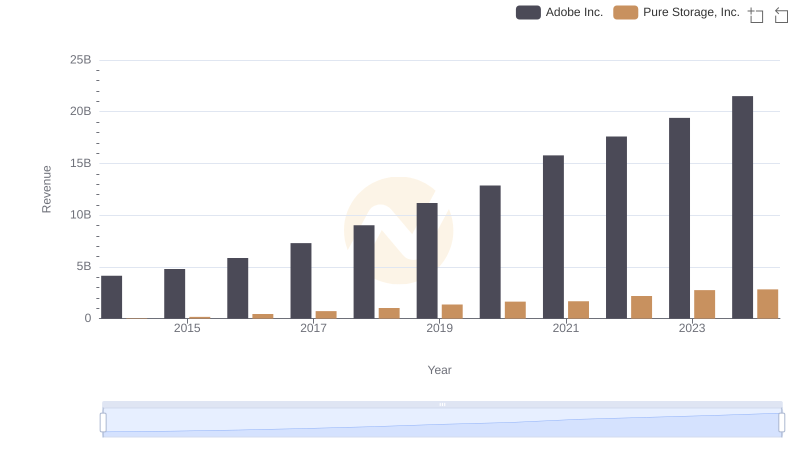
Who Generates More Revenue? Adobe Inc. or Pure Storage, Inc.
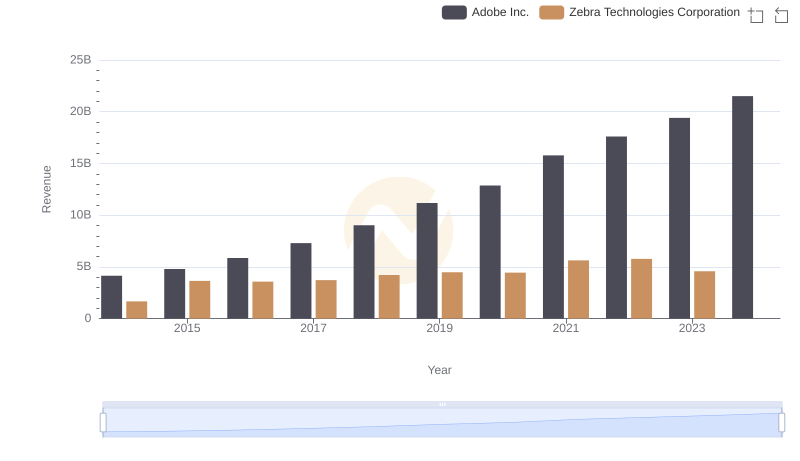
Revenue Showdown: Adobe Inc. vs Zebra Technologies Corporation
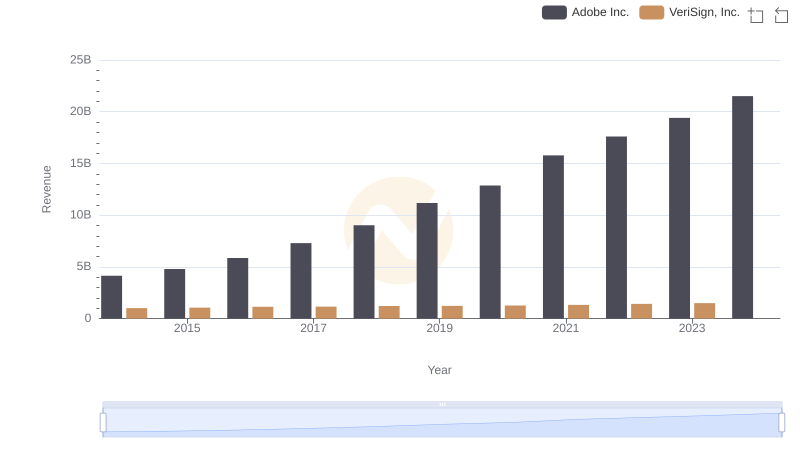
Adobe Inc. and VeriSign, Inc.: A Comprehensive Revenue Analysis
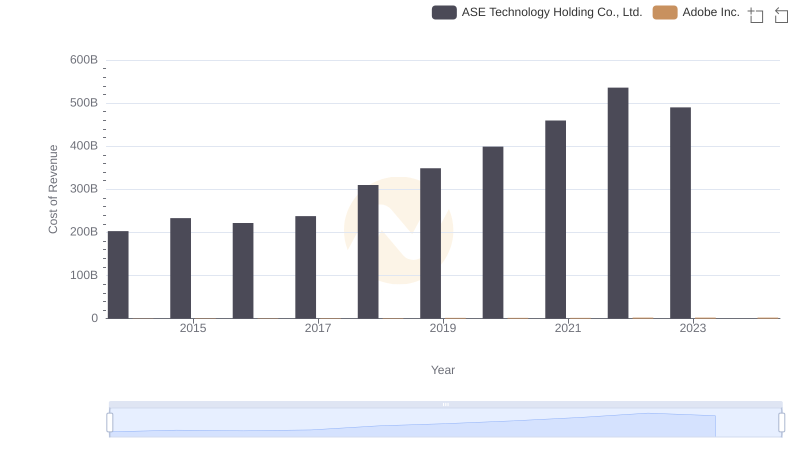
Comparing Cost of Revenue Efficiency: Adobe Inc. vs ASE Technology Holding Co., Ltd.
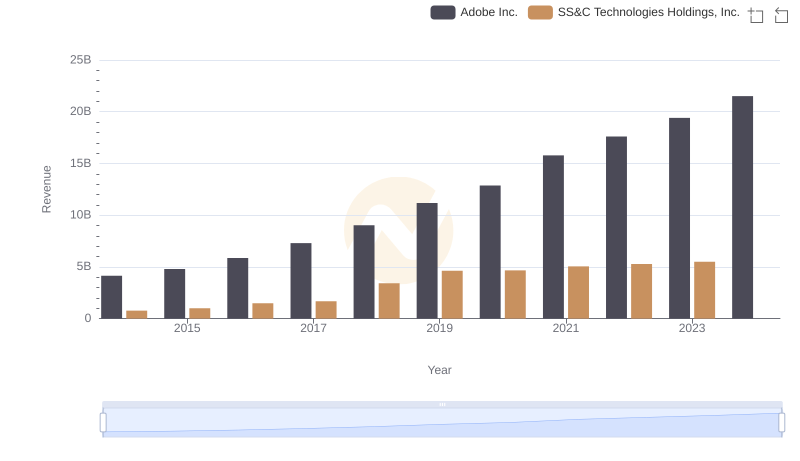
Comparing Revenue Performance: Adobe Inc. or SS&C Technologies Holdings, Inc.?
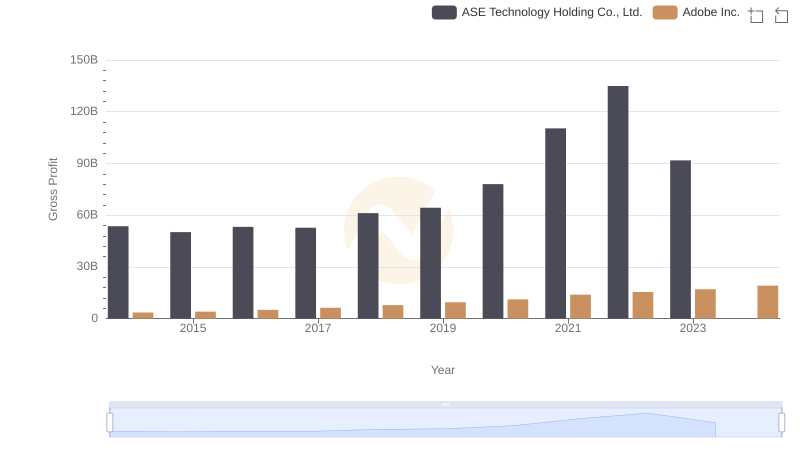
Adobe Inc. vs ASE Technology Holding Co., Ltd.: A Gross Profit Performance Breakdown
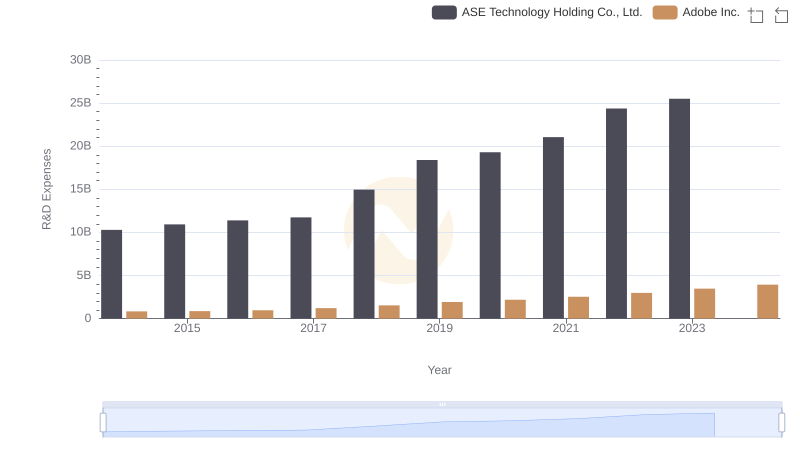
Research and Development Investment: Adobe Inc. vs ASE Technology Holding Co., Ltd.
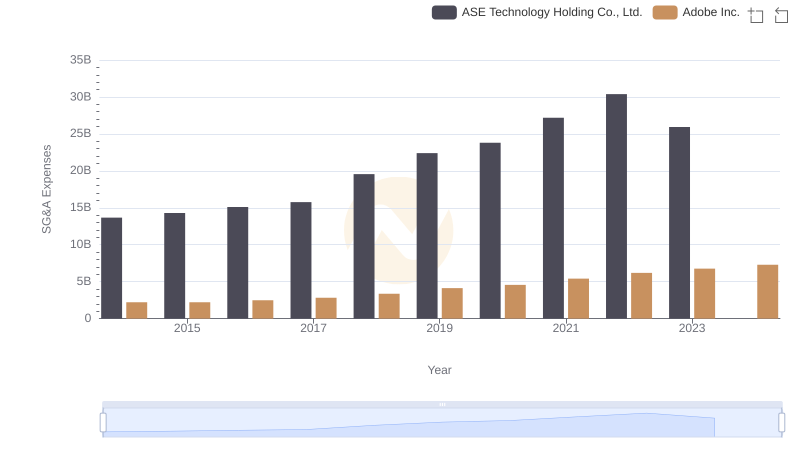
Operational Costs Compared: SG&A Analysis of Adobe Inc. and ASE Technology Holding Co., Ltd.
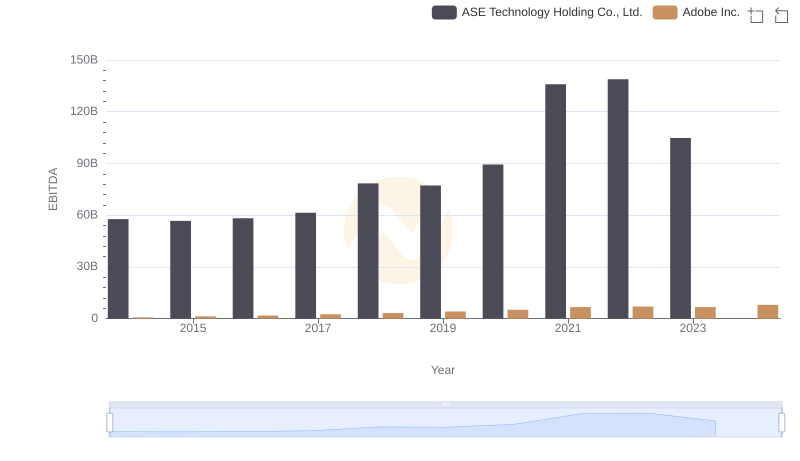
EBITDA Metrics Evaluated: Adobe Inc. vs ASE Technology Holding Co., Ltd.