| __timestamp | Adobe Inc. | Leidos Holdings, Inc. |
|---|---|---|
| Wednesday, January 1, 2014 | 2215140000 | 310000000 |
| Thursday, January 1, 2015 | 2215161000 | 232000000 |
| Friday, January 1, 2016 | 2487907000 | 334000000 |
| Sunday, January 1, 2017 | 2822298000 | 552000000 |
| Monday, January 1, 2018 | 3365727000 | 729000000 |
| Tuesday, January 1, 2019 | 4124984000 | 689000000 |
| Wednesday, January 1, 2020 | 4559000000 | 770000000 |
| Friday, January 1, 2021 | 5406000000 | 860000000 |
| Saturday, January 1, 2022 | 6187000000 | 950000000 |
| Sunday, January 1, 2023 | 6764000000 | 942000000 |
| Monday, January 1, 2024 | 7293000000 | 983000000 |
Unleashing the power of data
In the ever-evolving landscape of corporate America, understanding the financial strategies of industry leaders is crucial. Adobe Inc. and Leidos Holdings, Inc. offer a fascinating study in contrasts when it comes to their Selling, General, and Administrative (SG&A) expenses over the past decade.
From 2014 to 2023, Adobe's SG&A expenses have surged by over 230%, reflecting its aggressive growth and expansion strategies. In contrast, Leidos Holdings, Inc. has maintained a more conservative trajectory, with a 200% increase in the same period. This divergence highlights Adobe's focus on scaling its operations, while Leidos appears to prioritize steady, sustainable growth.
Interestingly, the data for 2024 is incomplete, leaving room for speculation on future trends. As these companies continue to navigate the complexities of their respective industries, their financial strategies will undoubtedly remain a topic of keen interest.
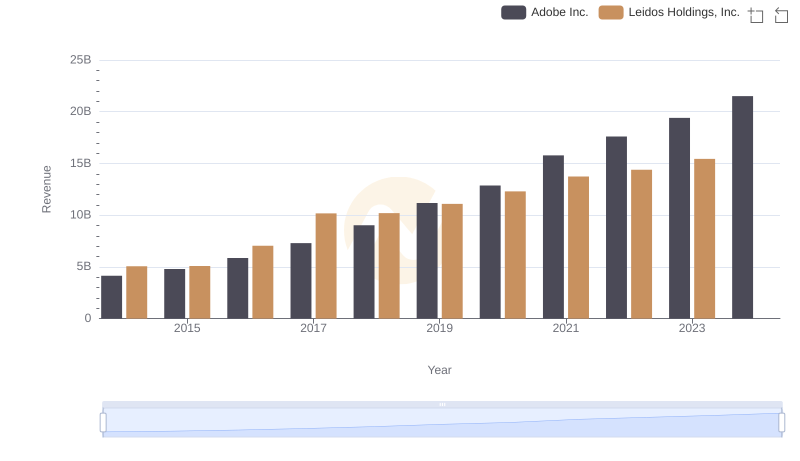
Adobe Inc. and Leidos Holdings, Inc.: A Comprehensive Revenue Analysis
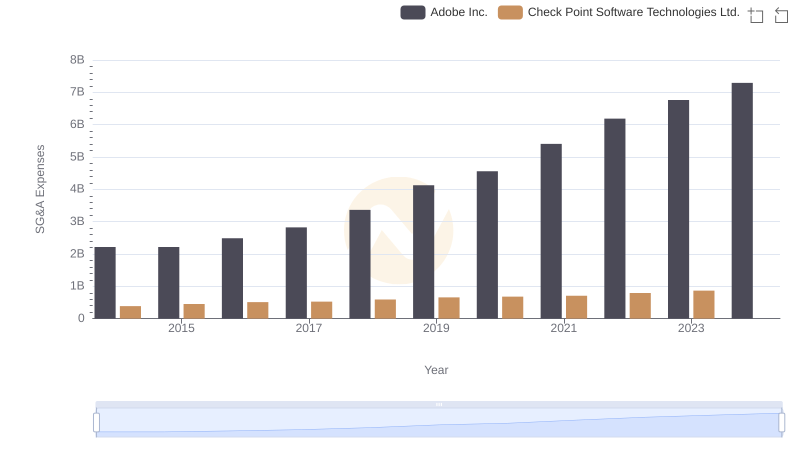
Adobe Inc. and Check Point Software Technologies Ltd.: SG&A Spending Patterns Compared
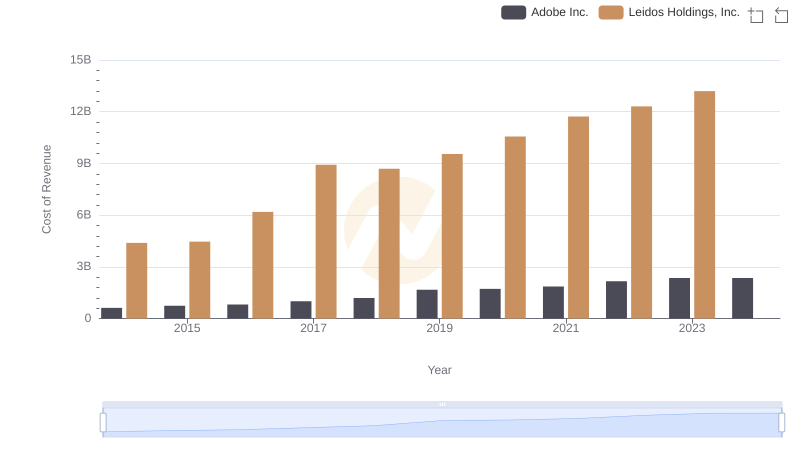
Comparing Cost of Revenue Efficiency: Adobe Inc. vs Leidos Holdings, Inc.
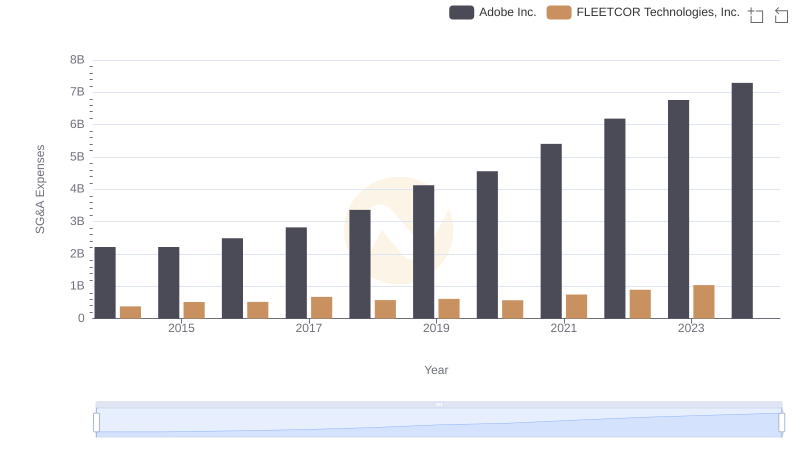
Adobe Inc. or FLEETCOR Technologies, Inc.: Who Manages SG&A Costs Better?
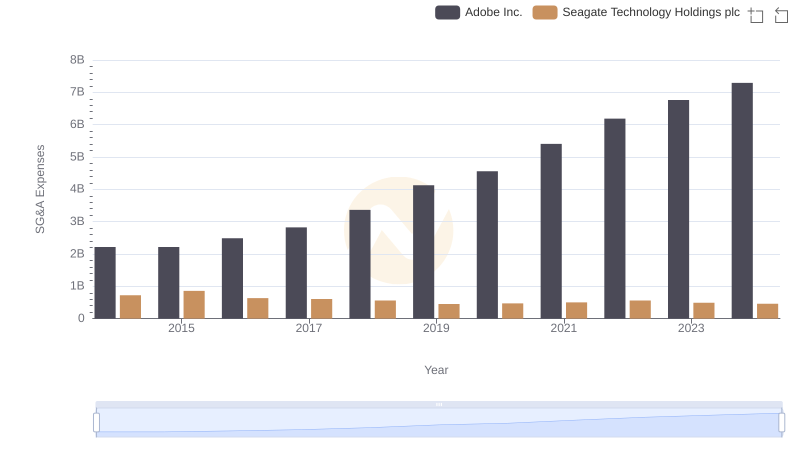
Operational Costs Compared: SG&A Analysis of Adobe Inc. and Seagate Technology Holdings plc
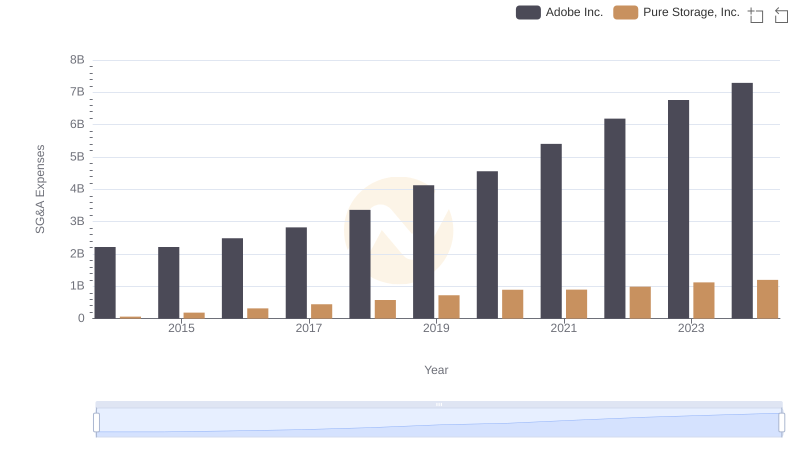
Comparing SG&A Expenses: Adobe Inc. vs Pure Storage, Inc. Trends and Insights
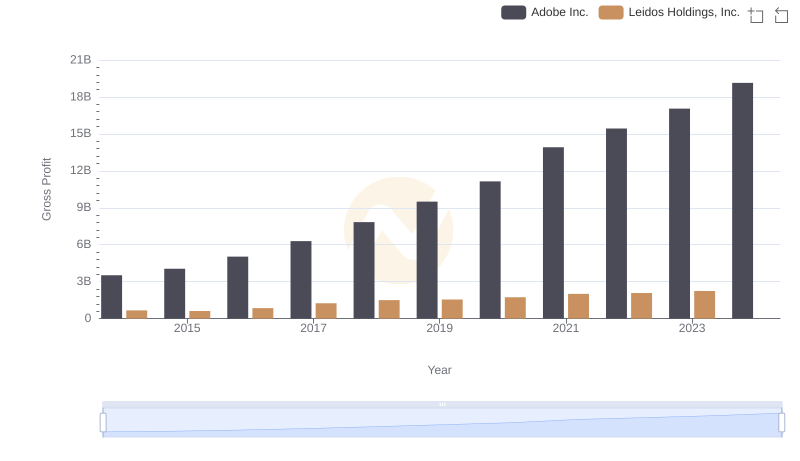
Who Generates Higher Gross Profit? Adobe Inc. or Leidos Holdings, Inc.

Comparing SG&A Expenses: Adobe Inc. vs Zebra Technologies Corporation Trends and Insights
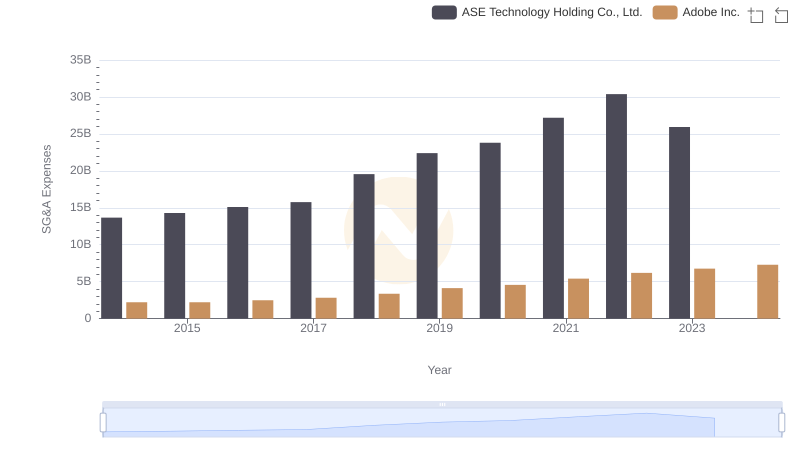
Operational Costs Compared: SG&A Analysis of Adobe Inc. and ASE Technology Holding Co., Ltd.

Comparing SG&A Expenses: Adobe Inc. vs SS&C Technologies Holdings, Inc. Trends and Insights
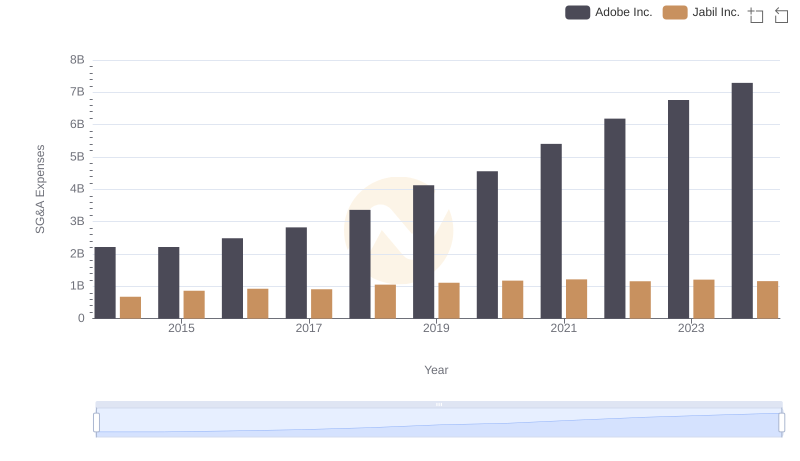
Breaking Down SG&A Expenses: Adobe Inc. vs Jabil Inc.
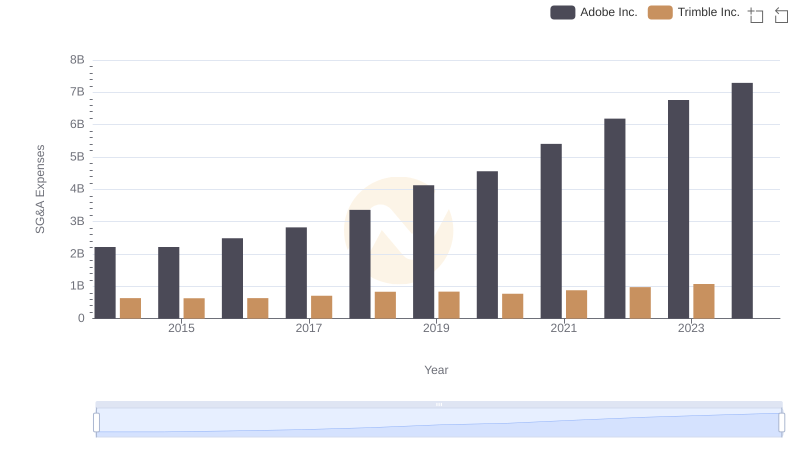
SG&A Efficiency Analysis: Comparing Adobe Inc. and Trimble Inc.