| __timestamp | Lennox International Inc. | U-Haul Holding Company |
|---|---|---|
| Wednesday, January 1, 2014 | 3367400000 | 2835252000 |
| Thursday, January 1, 2015 | 3467400000 | 3074531000 |
| Friday, January 1, 2016 | 3641600000 | 3275656000 |
| Sunday, January 1, 2017 | 3839600000 | 3421767000 |
| Monday, January 1, 2018 | 3883900000 | 3601114000 |
| Tuesday, January 1, 2019 | 3807200000 | 3768707000 |
| Wednesday, January 1, 2020 | 3634100000 | 3978868000 |
| Friday, January 1, 2021 | 4194100000 | 4541985000 |
| Saturday, January 1, 2022 | 4718400000 | 5739747000 |
| Sunday, January 1, 2023 | 4981900000 | 5864691000 |
| Monday, January 1, 2024 | 5341300000 | 5625674000 |
Infusing magic into the data realm
In the ever-evolving landscape of American business, Lennox International Inc. and U-Haul Holding Company have demonstrated remarkable resilience and growth over the past decade. From 2014 to 2024, Lennox International Inc. has seen its revenue soar by approximately 59%, while U-Haul Holding Company has experienced an impressive 98% increase. This growth trajectory highlights the dynamic nature of these industries, with Lennox leading in HVAC solutions and U-Haul dominating the self-storage and moving sector.
These figures underscore the strategic initiatives and market adaptability that have propelled these companies to new heights.
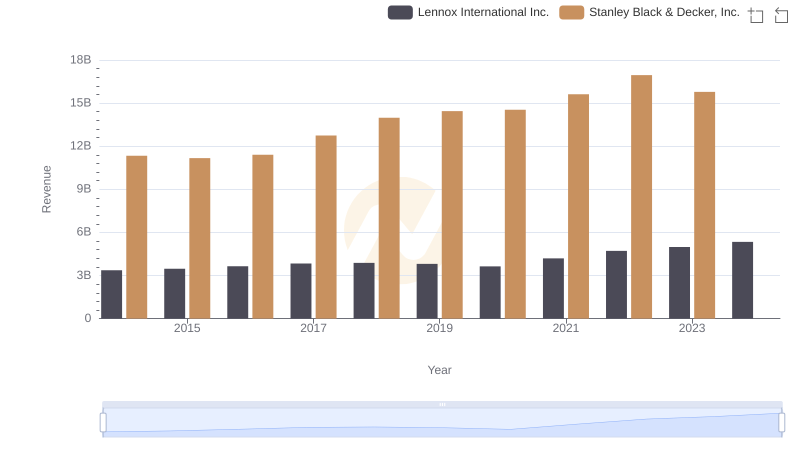
Lennox International Inc. and Stanley Black & Decker, Inc.: A Comprehensive Revenue Analysis
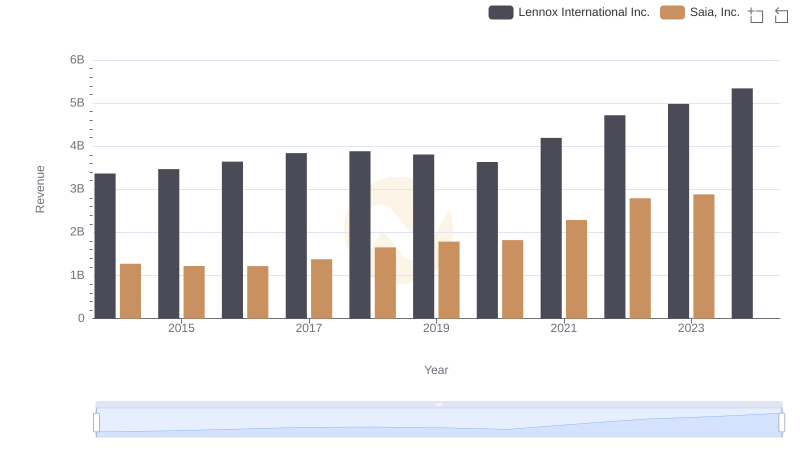
Revenue Insights: Lennox International Inc. and Saia, Inc. Performance Compared
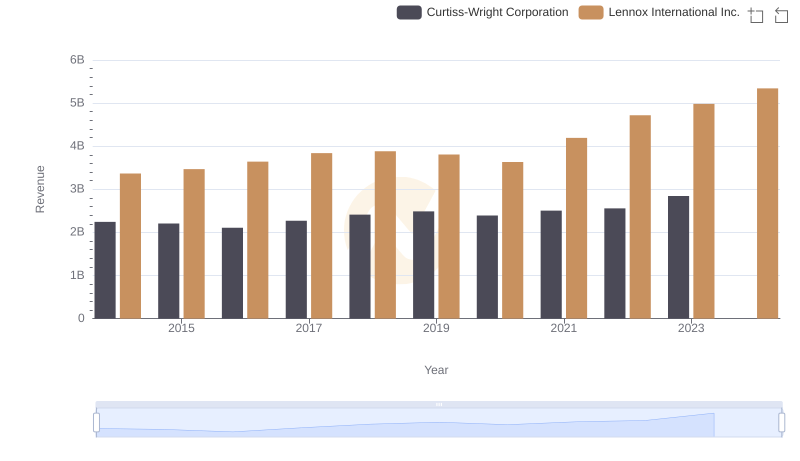
Revenue Showdown: Lennox International Inc. vs Curtiss-Wright Corporation
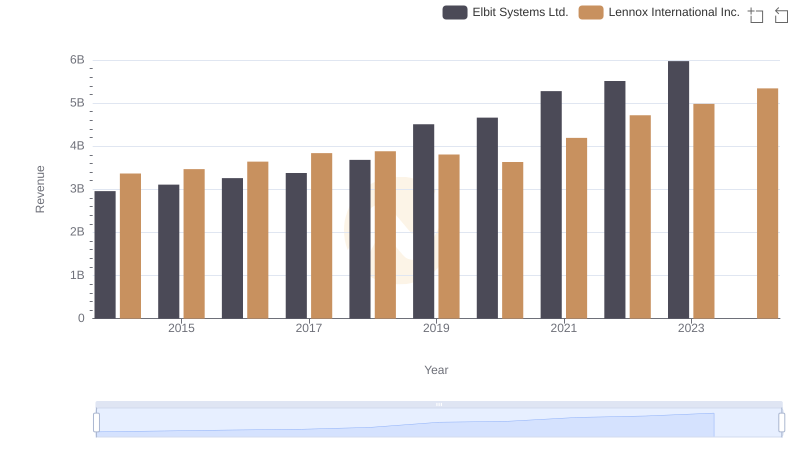
Lennox International Inc. or Elbit Systems Ltd.: Who Leads in Yearly Revenue?
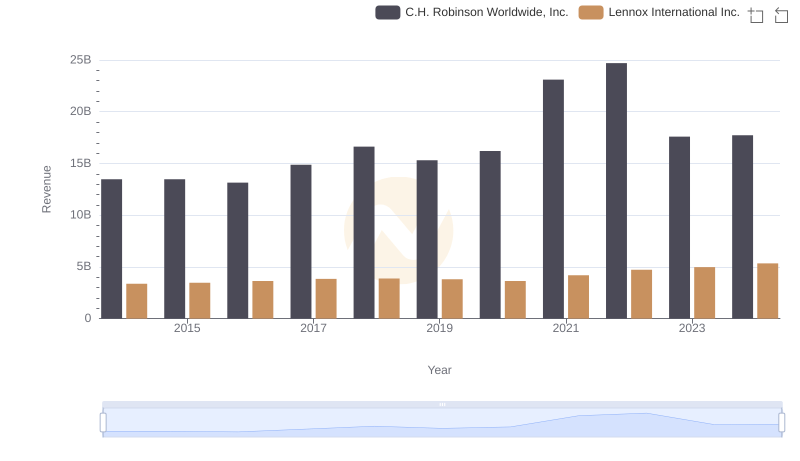
Revenue Showdown: Lennox International Inc. vs C.H. Robinson Worldwide, Inc.
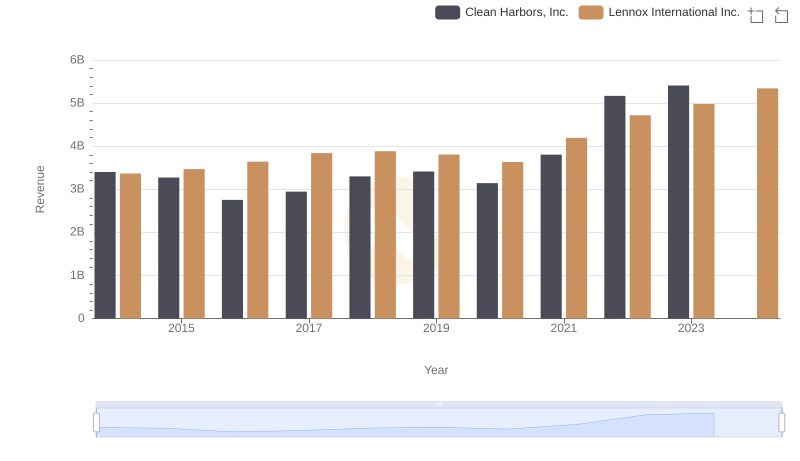
Comparing Revenue Performance: Lennox International Inc. or Clean Harbors, Inc.?
Cost Insights: Breaking Down Lennox International Inc. and U-Haul Holding Company's Expenses
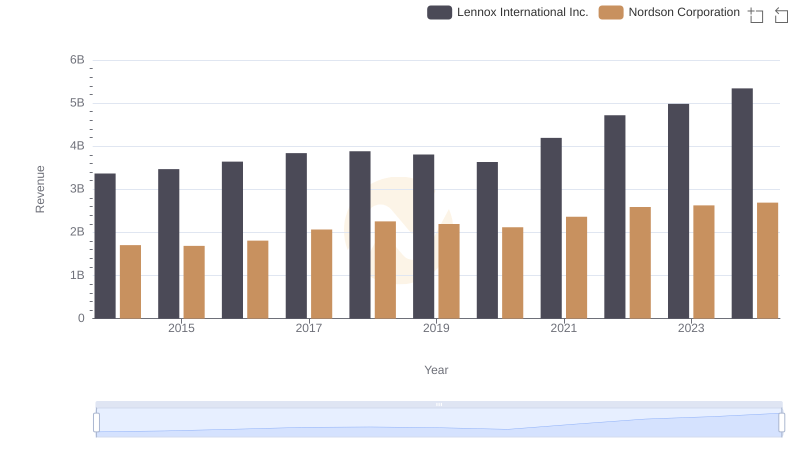
Revenue Showdown: Lennox International Inc. vs Nordson Corporation
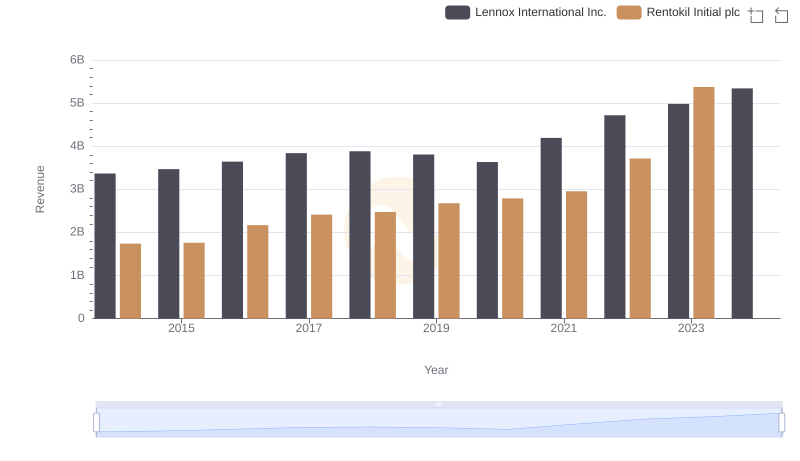
Annual Revenue Comparison: Lennox International Inc. vs Rentokil Initial plc
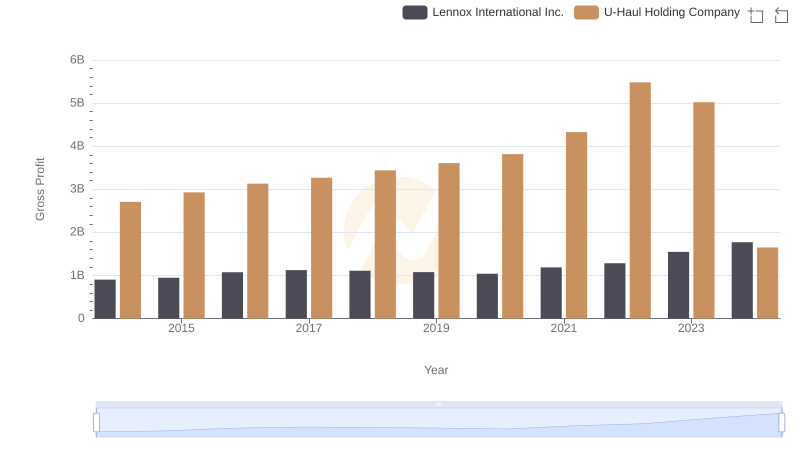
Lennox International Inc. vs U-Haul Holding Company: A Gross Profit Performance Breakdown
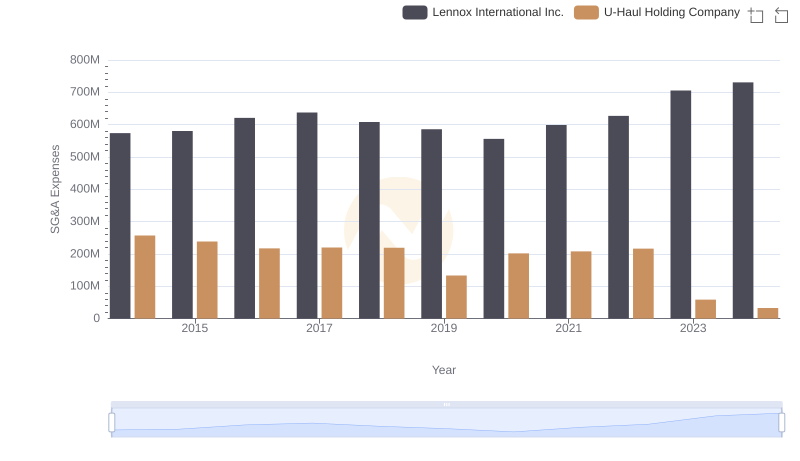
Selling, General, and Administrative Costs: Lennox International Inc. vs U-Haul Holding Company
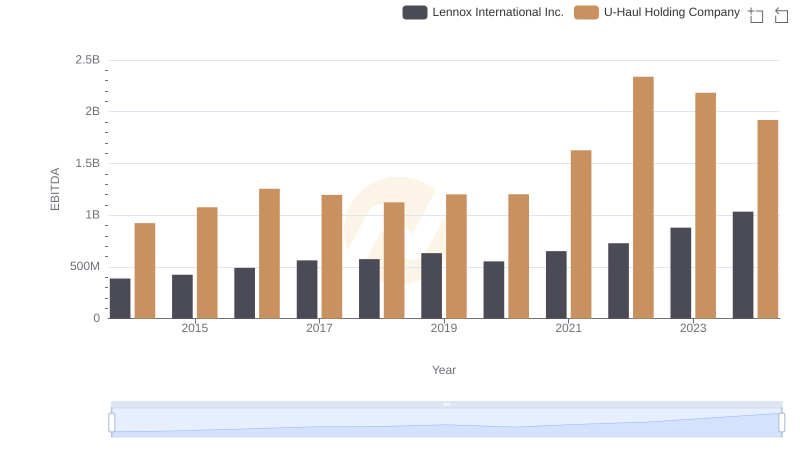
A Professional Review of EBITDA: Lennox International Inc. Compared to U-Haul Holding Company