| __timestamp | Lennox International Inc. | ZTO Express (Cayman) Inc. |
|---|---|---|
| Wednesday, January 1, 2014 | 3367400000 | 3903572000 |
| Thursday, January 1, 2015 | 3467400000 | 6086455000 |
| Friday, January 1, 2016 | 3641600000 | 9788768000 |
| Sunday, January 1, 2017 | 3839600000 | 13060073000 |
| Monday, January 1, 2018 | 3883900000 | 17604451000 |
| Tuesday, January 1, 2019 | 3807200000 | 22109946000 |
| Wednesday, January 1, 2020 | 3634100000 | 25214290000 |
| Friday, January 1, 2021 | 4194100000 | 30405839000 |
| Saturday, January 1, 2022 | 4718400000 | 35376996000 |
| Sunday, January 1, 2023 | 4981900000 | 38418915000 |
| Monday, January 1, 2024 | 5341300000 |
Unlocking the unknown
In the dynamic world of global business, understanding revenue trends is crucial. Lennox International Inc., a leader in climate control solutions, and ZTO Express (Cayman) Inc., a major player in express delivery services, offer a fascinating study in contrasting growth trajectories from 2014 to 2023.
Lennox International Inc. has seen a steady revenue increase, growing approximately 59% over the decade. Starting at $3.37 billion in 2014, it reached $5.34 billion by 2023. This consistent growth reflects its robust market position and strategic innovations.
Conversely, ZTO Express (Cayman) Inc. experienced a staggering 884% revenue surge, from $3.90 billion in 2014 to $38.42 billion in 2023. This explosive growth underscores the booming e-commerce sector in China and ZTO's strategic expansion.
While Lennox's data extends to 2024, ZTO's data for 2024 is unavailable, highlighting potential data collection challenges.
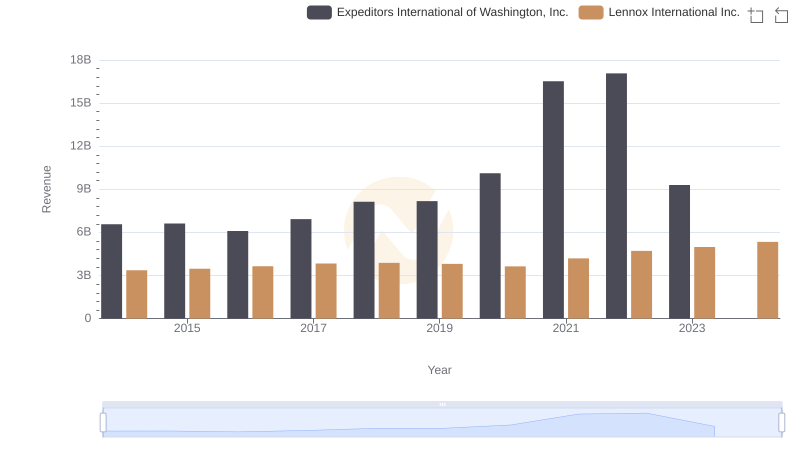
Lennox International Inc. vs Expeditors International of Washington, Inc.: Examining Key Revenue Metrics
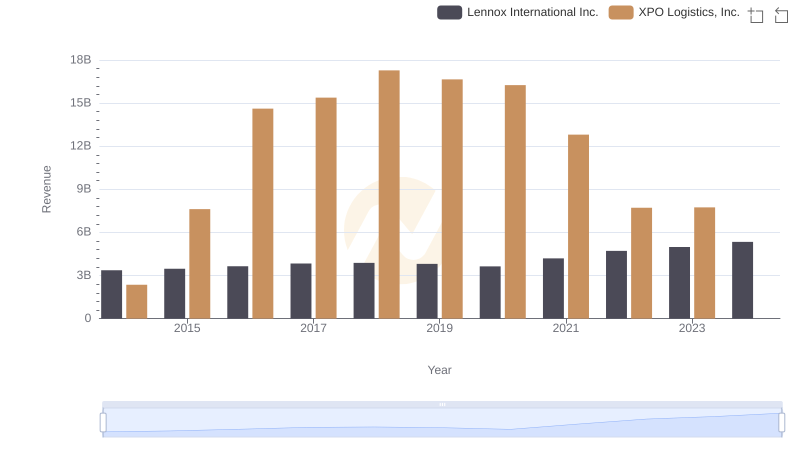
Revenue Showdown: Lennox International Inc. vs XPO Logistics, Inc.
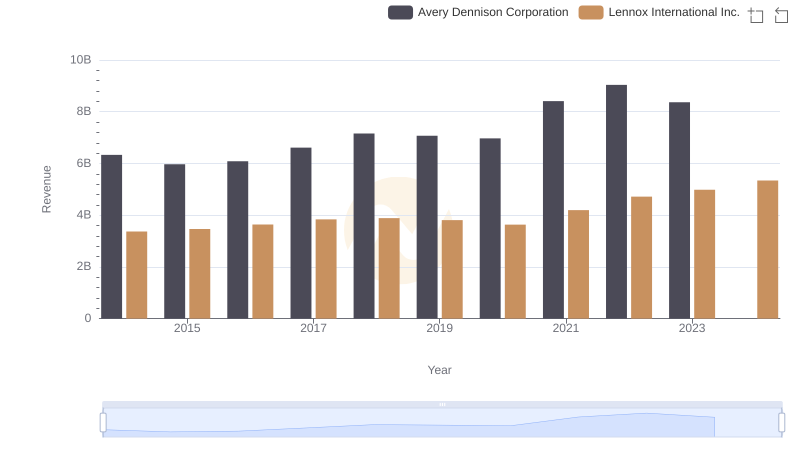
Lennox International Inc. and Avery Dennison Corporation: A Comprehensive Revenue Analysis
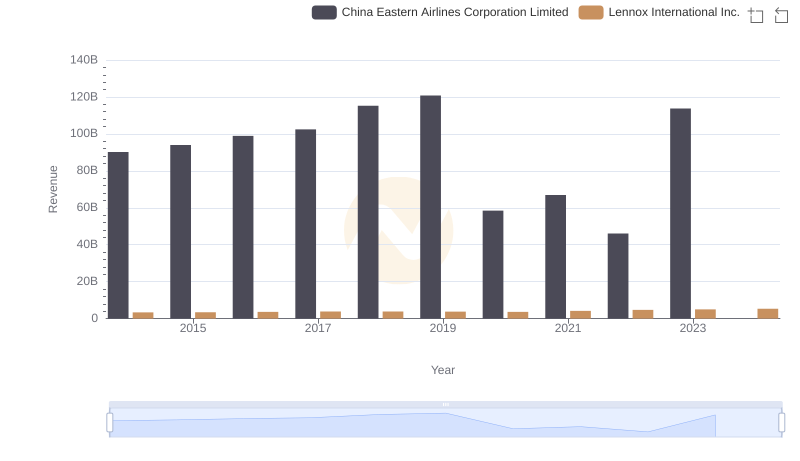
Revenue Insights: Lennox International Inc. and China Eastern Airlines Corporation Limited Performance Compared
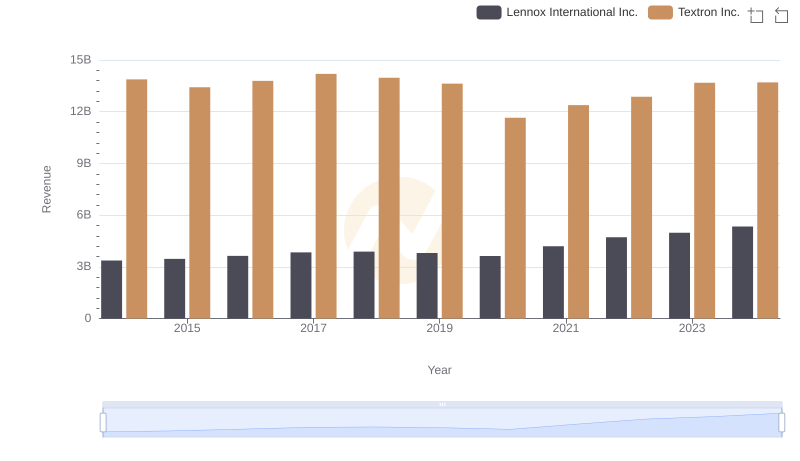
Lennox International Inc. vs Textron Inc.: Annual Revenue Growth Compared
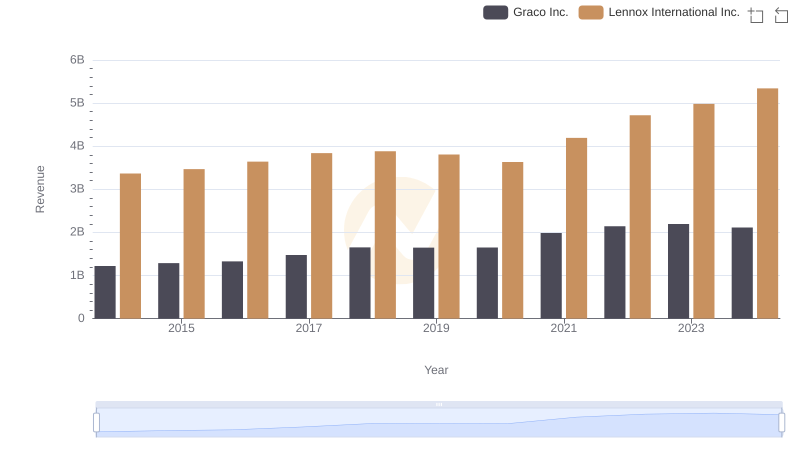
Revenue Showdown: Lennox International Inc. vs Graco Inc.
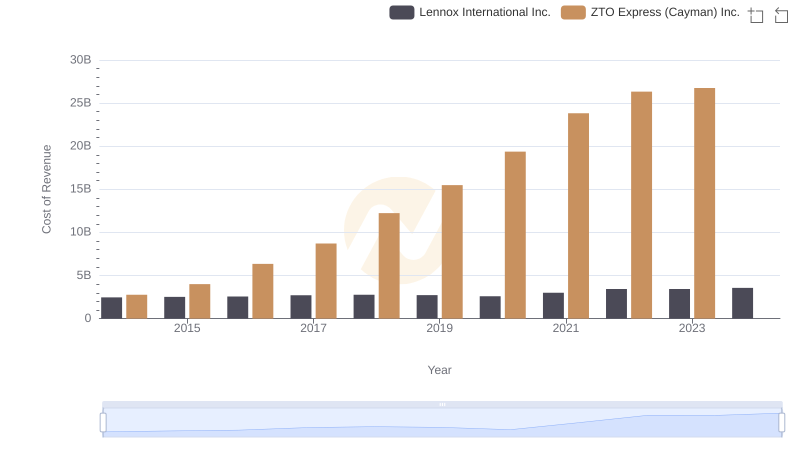
Lennox International Inc. vs ZTO Express (Cayman) Inc.: Efficiency in Cost of Revenue Explored
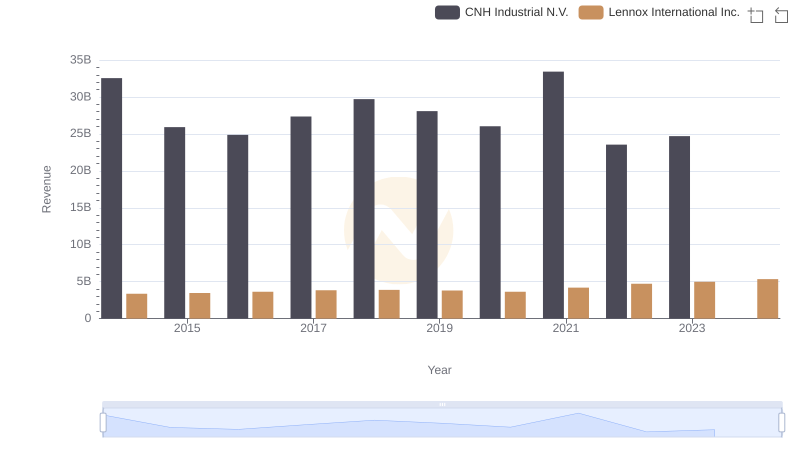
Lennox International Inc. and CNH Industrial N.V.: A Comprehensive Revenue Analysis
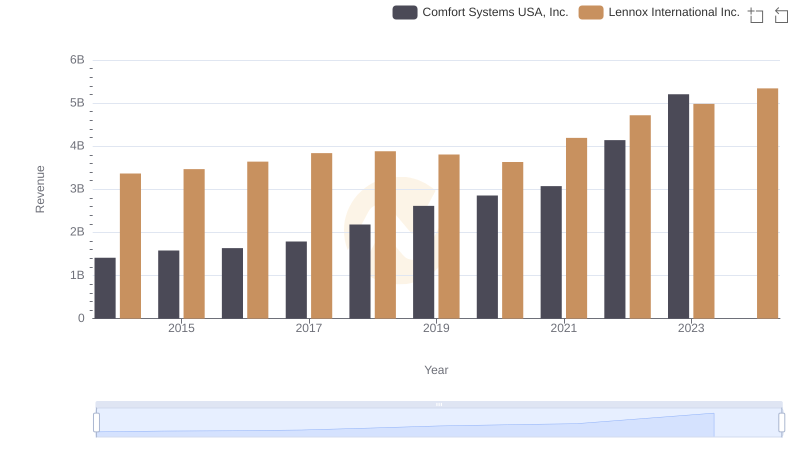
Lennox International Inc. vs Comfort Systems USA, Inc.: Annual Revenue Growth Compared
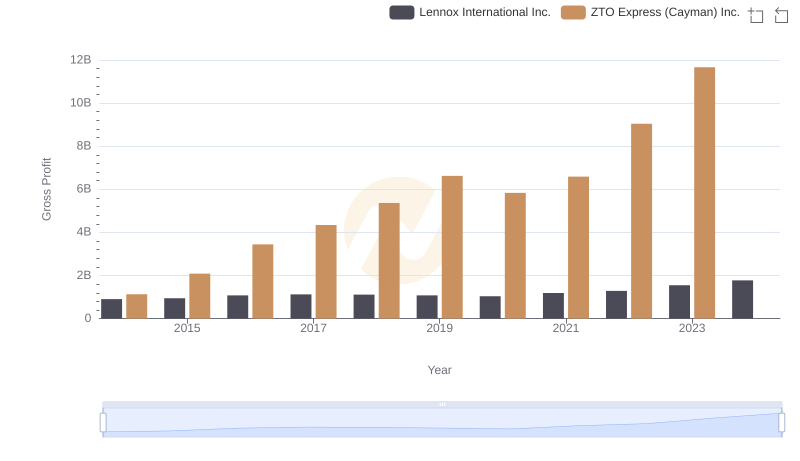
Gross Profit Comparison: Lennox International Inc. and ZTO Express (Cayman) Inc. Trends
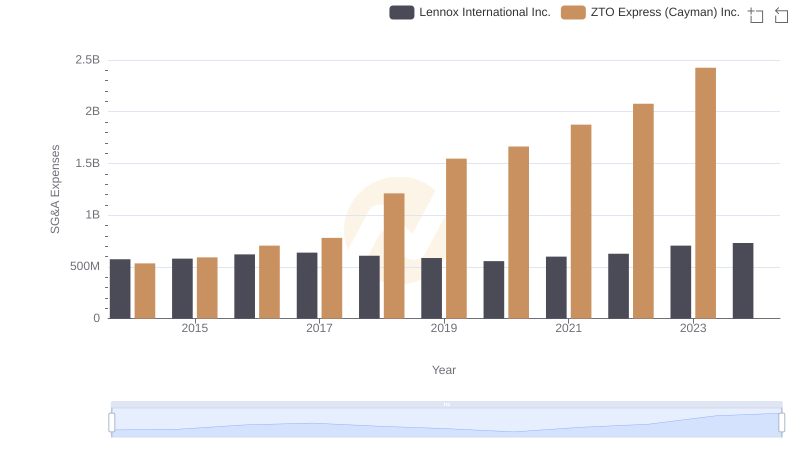
Operational Costs Compared: SG&A Analysis of Lennox International Inc. and ZTO Express (Cayman) Inc.
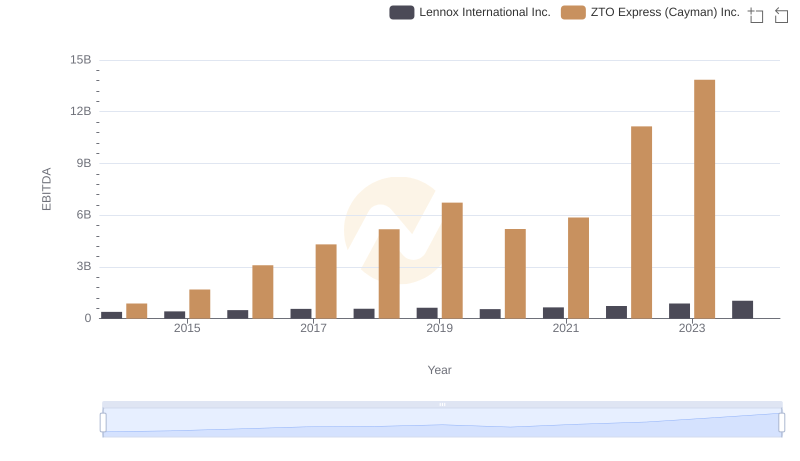
A Professional Review of EBITDA: Lennox International Inc. Compared to ZTO Express (Cayman) Inc.