| __timestamp | Lennox International Inc. | RB Global, Inc. |
|---|---|---|
| Wednesday, January 1, 2014 | 903300000 | 423213000 |
| Thursday, January 1, 2015 | 947400000 | 459849000 |
| Friday, January 1, 2016 | 1076500000 | 500333000 |
| Sunday, January 1, 2017 | 1125200000 | 531504000 |
| Monday, January 1, 2018 | 1111200000 | 636629000 |
| Tuesday, January 1, 2019 | 1079800000 | 672825000 |
| Wednesday, January 1, 2020 | 1040100000 | 761671000 |
| Friday, January 1, 2021 | 1188400000 | 822188000 |
| Saturday, January 1, 2022 | 1284700000 | 957107000 |
| Sunday, January 1, 2023 | 1547800000 | 1778400000 |
| Monday, January 1, 2024 | 1771900000 | 4284200000 |
Cracking the code
In the competitive landscape of industrial giants, Lennox International Inc. and RB Global, Inc. have showcased remarkable growth in gross profit over the past decade. From 2014 to 2023, Lennox International Inc. has seen its gross profit soar by approximately 96%, starting from 903 million to an impressive 1.77 billion. Meanwhile, RB Global, Inc. has experienced a staggering 320% increase, reaching 1.78 billion in 2023 from 423 million in 2014.
The year 2023 marked a significant milestone for both companies, with RB Global, Inc. surpassing Lennox International Inc. in gross profit for the first time. However, data for 2024 remains incomplete, leaving room for speculation on future trends. This performance breakdown not only highlights the resilience and strategic prowess of these companies but also sets the stage for an intriguing financial rivalry in the years to come.
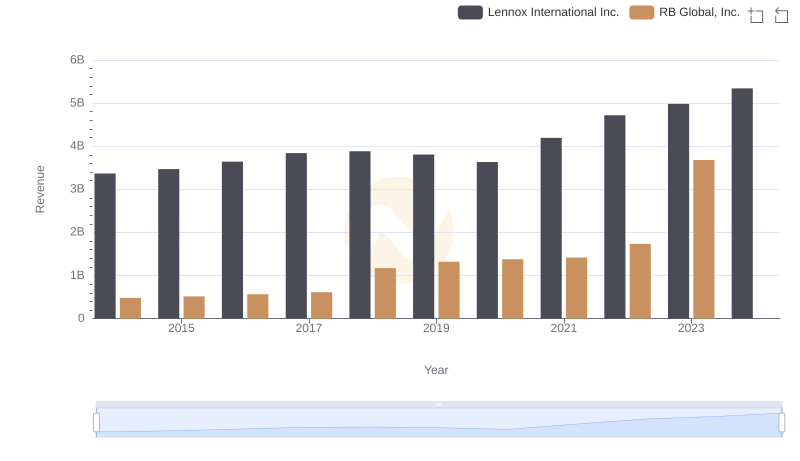
Comparing Revenue Performance: Lennox International Inc. or RB Global, Inc.?
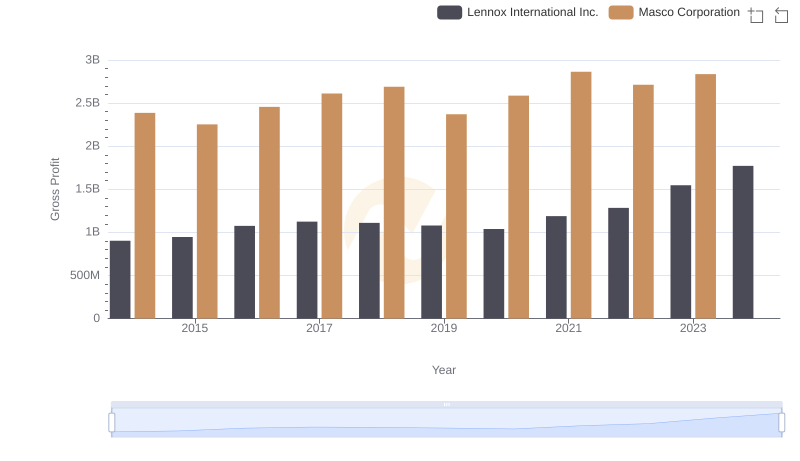
Gross Profit Trends Compared: Lennox International Inc. vs Masco Corporation
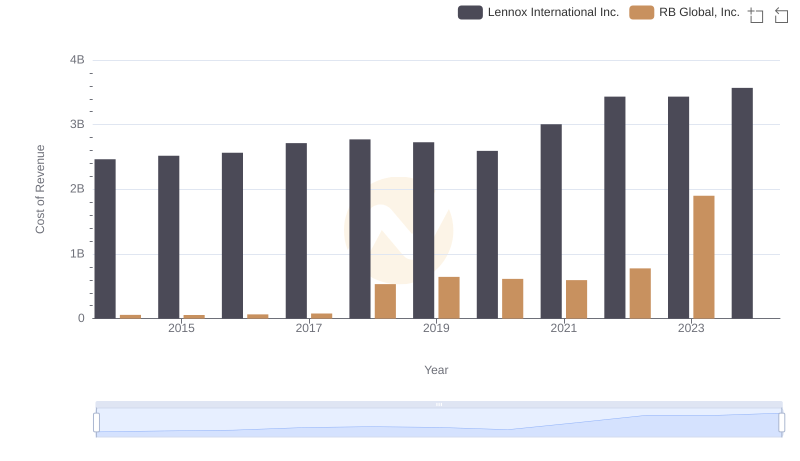
Cost of Revenue Comparison: Lennox International Inc. vs RB Global, Inc.
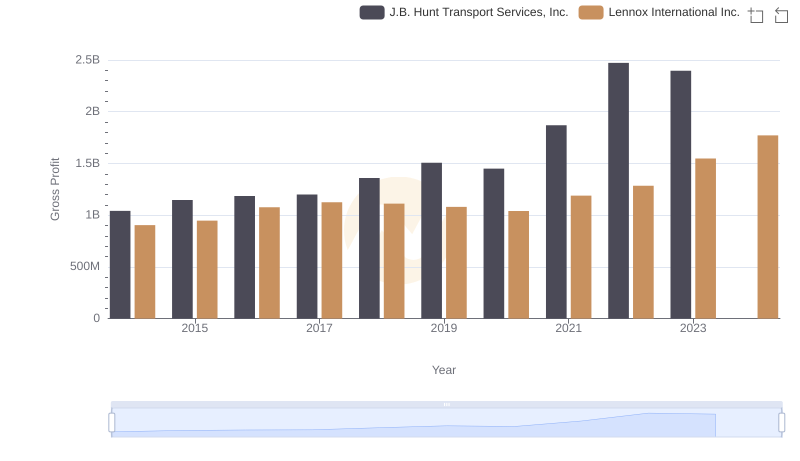
Lennox International Inc. and J.B. Hunt Transport Services, Inc.: A Detailed Gross Profit Analysis
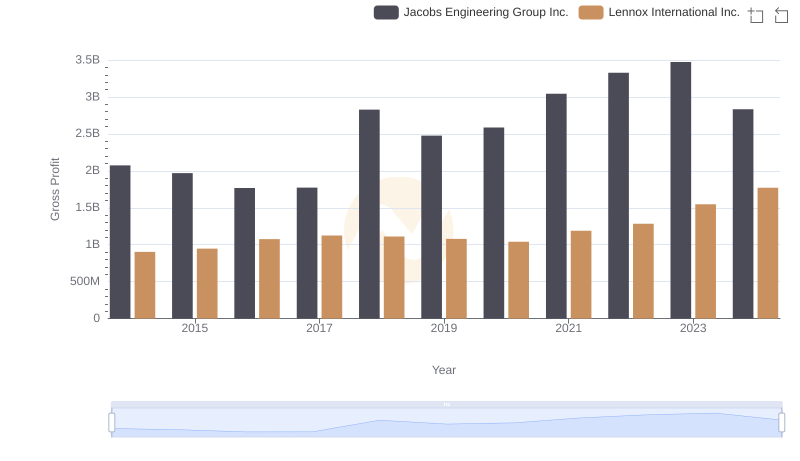
Who Generates Higher Gross Profit? Lennox International Inc. or Jacobs Engineering Group Inc.
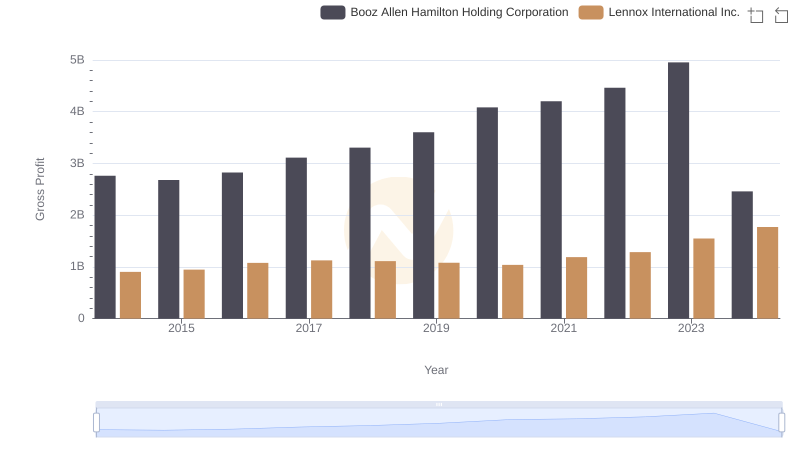
Gross Profit Trends Compared: Lennox International Inc. vs Booz Allen Hamilton Holding Corporation
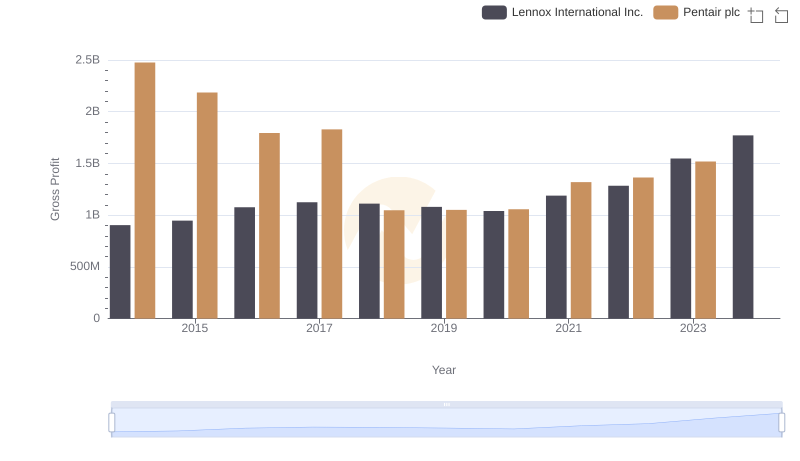
Gross Profit Analysis: Comparing Lennox International Inc. and Pentair plc
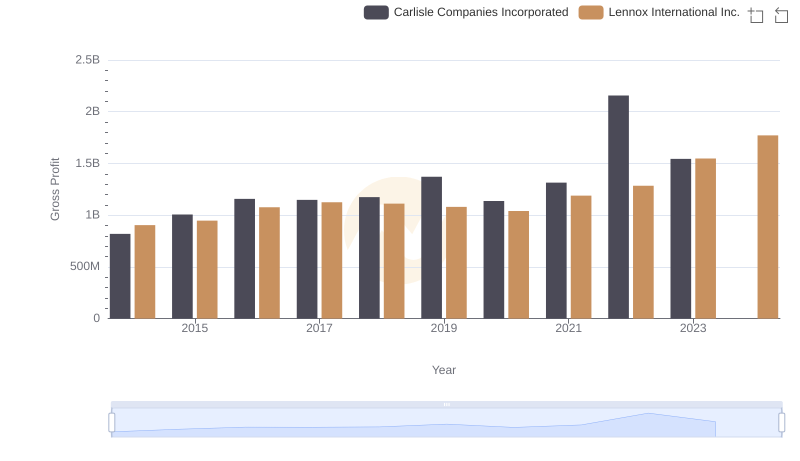
Gross Profit Trends Compared: Lennox International Inc. vs Carlisle Companies Incorporated
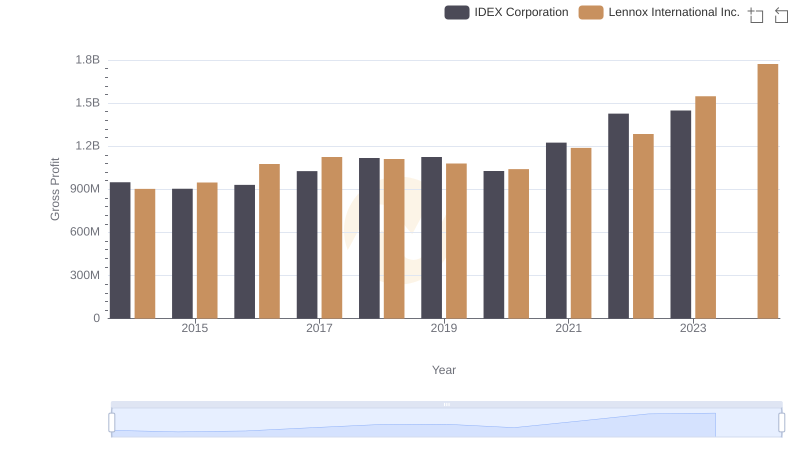
Gross Profit Comparison: Lennox International Inc. and IDEX Corporation Trends
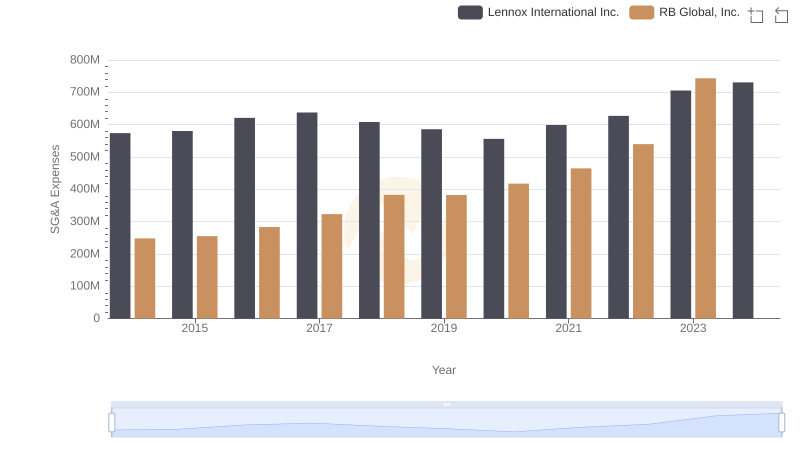
Operational Costs Compared: SG&A Analysis of Lennox International Inc. and RB Global, Inc.
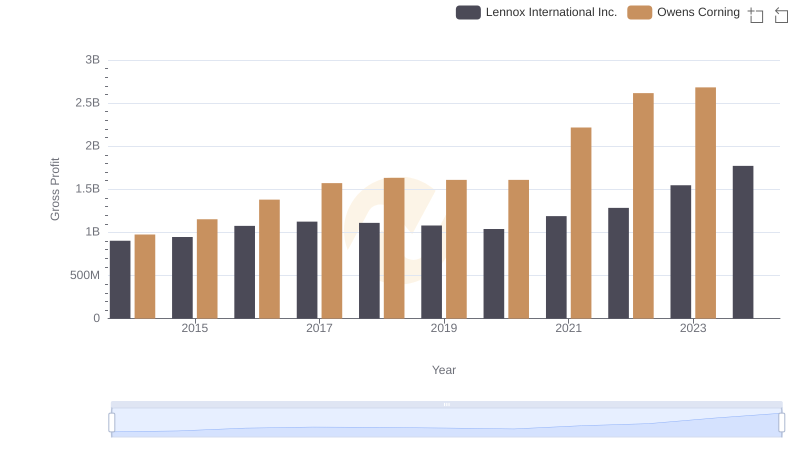
Gross Profit Analysis: Comparing Lennox International Inc. and Owens Corning
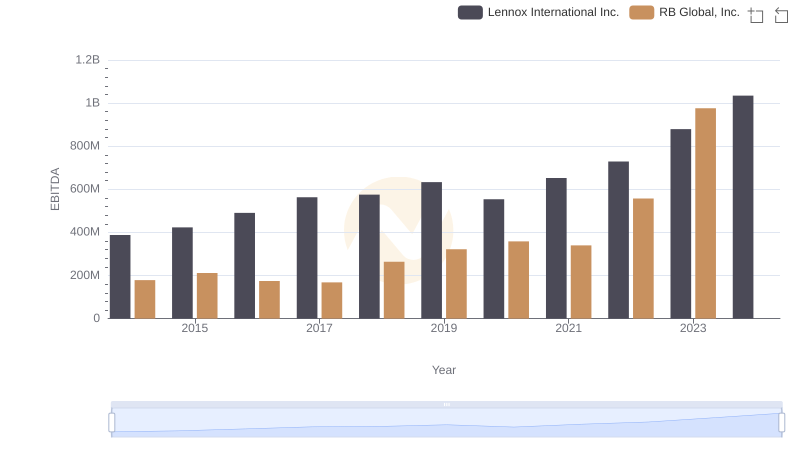
Lennox International Inc. and RB Global, Inc.: A Detailed Examination of EBITDA Performance