| __timestamp | Avery Dennison Corporation | Lennox International Inc. |
|---|---|---|
| Wednesday, January 1, 2014 | 1651200000 | 903300000 |
| Thursday, January 1, 2015 | 1645800000 | 947400000 |
| Friday, January 1, 2016 | 1699700000 | 1076500000 |
| Sunday, January 1, 2017 | 1812200000 | 1125200000 |
| Monday, January 1, 2018 | 1915500000 | 1111200000 |
| Tuesday, January 1, 2019 | 1904100000 | 1079800000 |
| Wednesday, January 1, 2020 | 1923300000 | 1040100000 |
| Friday, January 1, 2021 | 2312800000 | 1188400000 |
| Saturday, January 1, 2022 | 2404200000 | 1284700000 |
| Sunday, January 1, 2023 | 2277499999 | 1547800000 |
| Monday, January 1, 2024 | 2530700000 | 1771900000 |
Unleashing the power of data
In the competitive landscape of industrial manufacturing, Lennox International Inc. and Avery Dennison Corporation have showcased intriguing financial trajectories over the past decade. From 2014 to 2023, Avery Dennison consistently outperformed Lennox in gross profit, with a notable peak in 2022, reaching approximately 2.4 billion USD. This represents a robust 45% increase from its 2014 figures. Lennox, on the other hand, demonstrated a steady growth pattern, culminating in a 2023 gross profit of around 1.5 billion USD, marking a 71% rise since 2014.
The data reveals Avery Dennison's strategic prowess in maintaining a leading edge, while Lennox's growth trajectory highlights its resilience and potential for future expansion. However, the absence of Avery Dennison's 2024 data leaves room for speculation on its future performance. As these industry giants continue to evolve, their financial narratives offer valuable insights into market dynamics and strategic positioning.
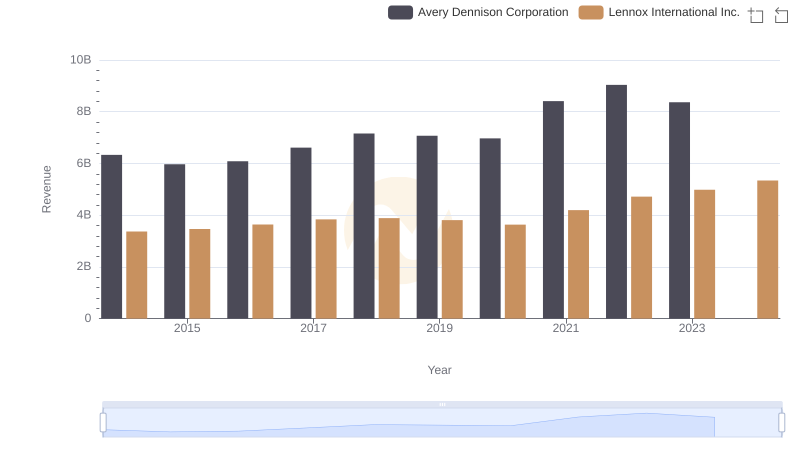
Lennox International Inc. and Avery Dennison Corporation: A Comprehensive Revenue Analysis
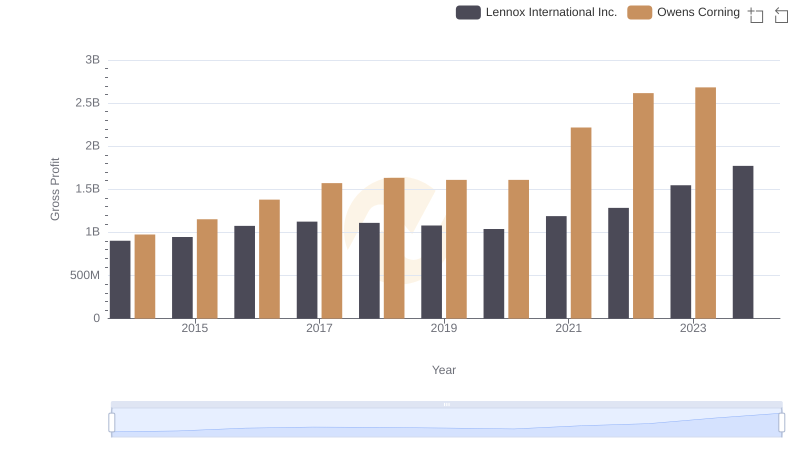
Gross Profit Analysis: Comparing Lennox International Inc. and Owens Corning
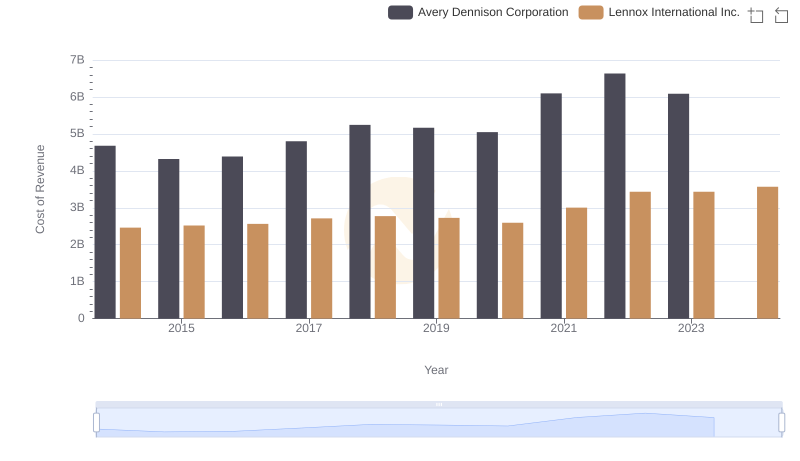
Cost of Revenue Comparison: Lennox International Inc. vs Avery Dennison Corporation
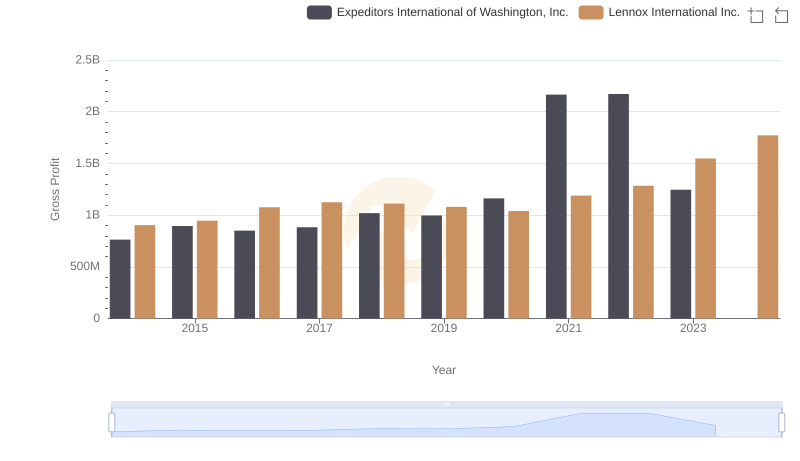
Gross Profit Trends Compared: Lennox International Inc. vs Expeditors International of Washington, Inc.
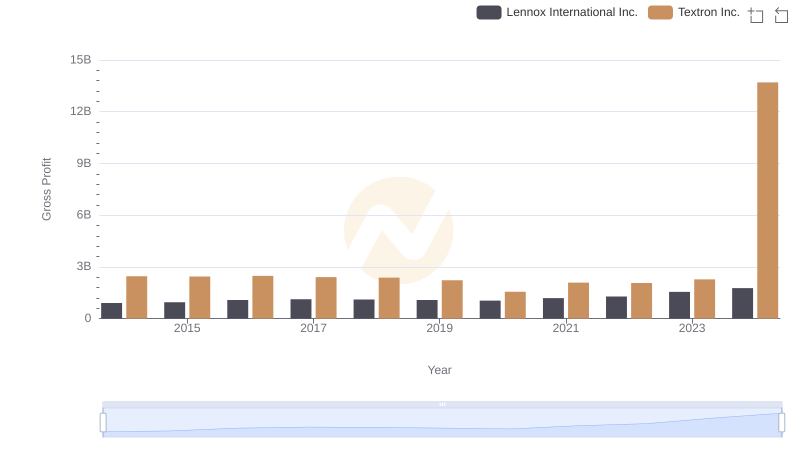
Gross Profit Comparison: Lennox International Inc. and Textron Inc. Trends
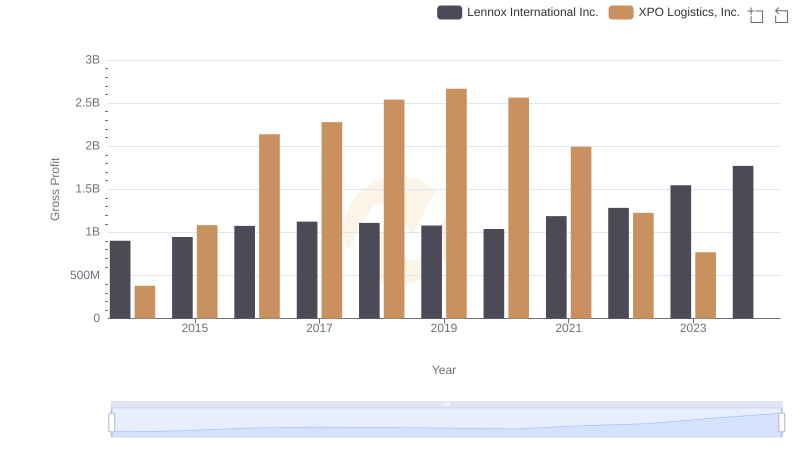
Gross Profit Comparison: Lennox International Inc. and XPO Logistics, Inc. Trends
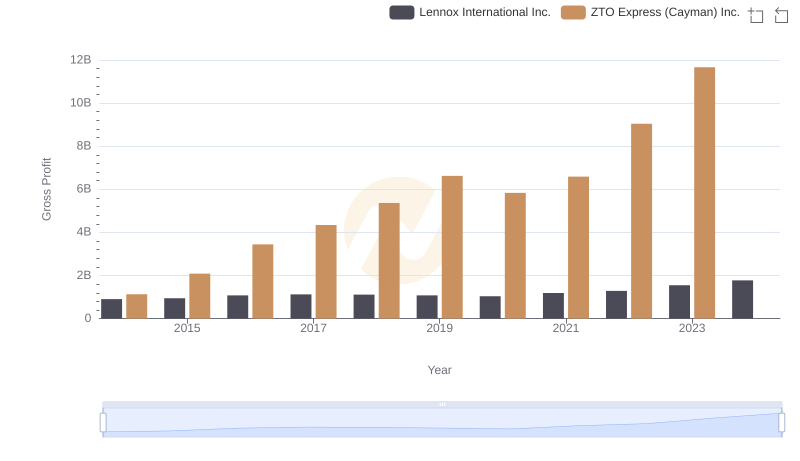
Gross Profit Comparison: Lennox International Inc. and ZTO Express (Cayman) Inc. Trends
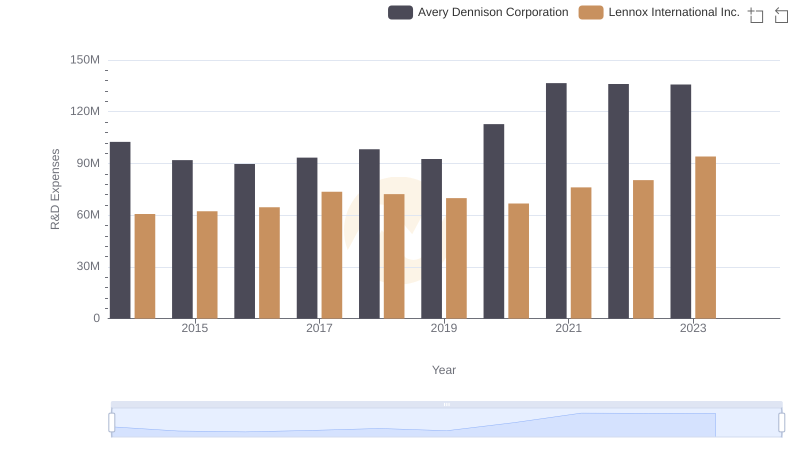
Lennox International Inc. or Avery Dennison Corporation: Who Invests More in Innovation?
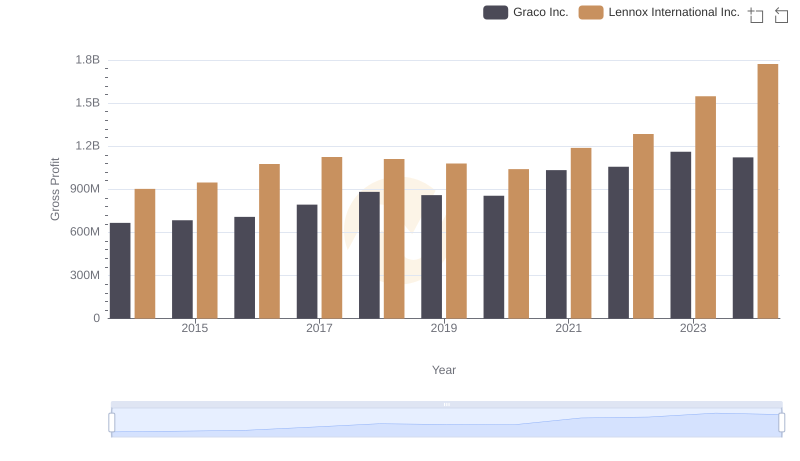
Lennox International Inc. and Graco Inc.: A Detailed Gross Profit Analysis
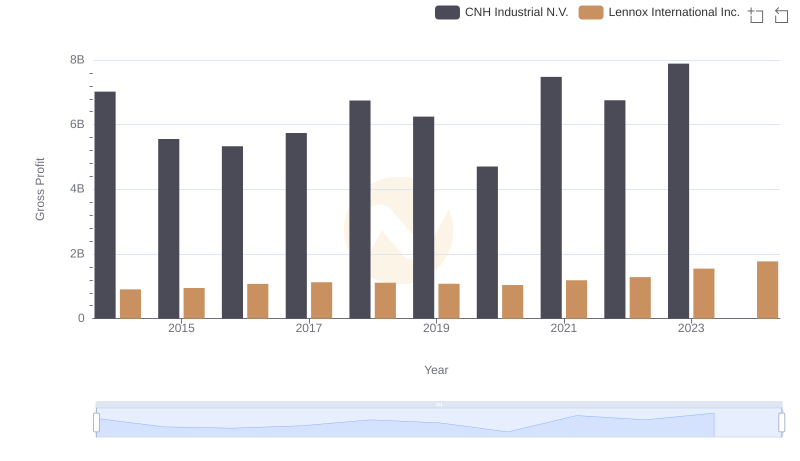
Lennox International Inc. and CNH Industrial N.V.: A Detailed Gross Profit Analysis
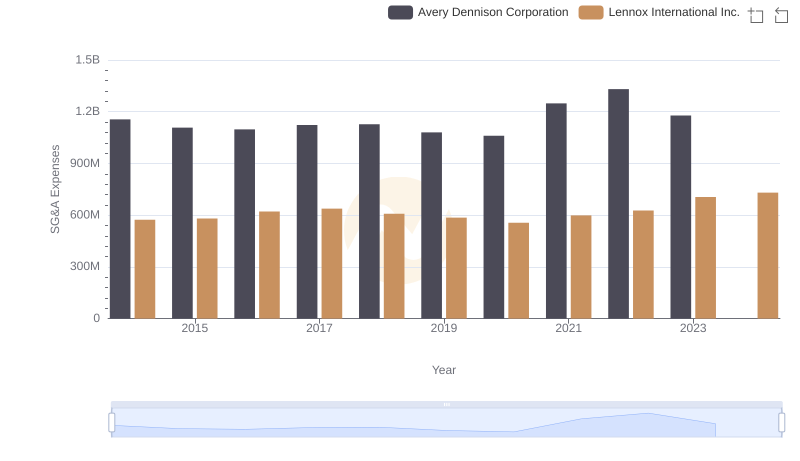
Operational Costs Compared: SG&A Analysis of Lennox International Inc. and Avery Dennison Corporation
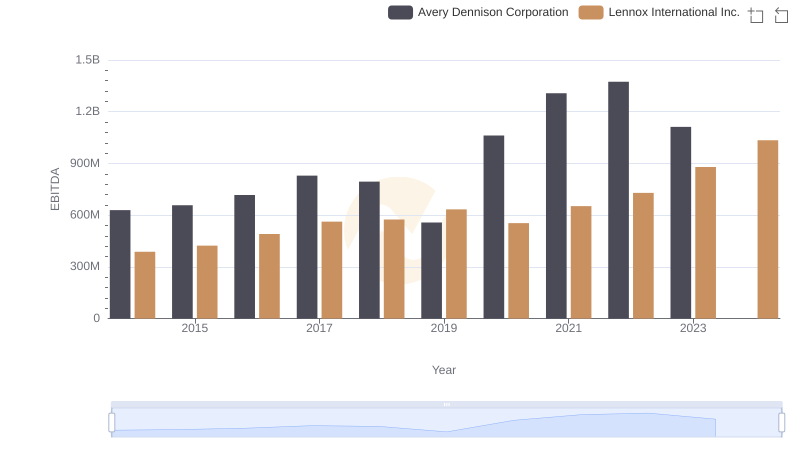
A Professional Review of EBITDA: Lennox International Inc. Compared to Avery Dennison Corporation