| __timestamp | Expeditors International of Washington, Inc. | Lennox International Inc. |
|---|---|---|
| Wednesday, January 1, 2014 | 763996000 | 903300000 |
| Thursday, January 1, 2015 | 895784000 | 947400000 |
| Friday, January 1, 2016 | 850793000 | 1076500000 |
| Sunday, January 1, 2017 | 883027000 | 1125200000 |
| Monday, January 1, 2018 | 1020282000 | 1111200000 |
| Tuesday, January 1, 2019 | 997021000 | 1079800000 |
| Wednesday, January 1, 2020 | 1162765000 | 1040100000 |
| Friday, January 1, 2021 | 2165412000 | 1188400000 |
| Saturday, January 1, 2022 | 2171130000 | 1284700000 |
| Sunday, January 1, 2023 | 1245476000 | 1547800000 |
| Monday, January 1, 2024 | 10600515000 | 1771900000 |
Igniting the spark of knowledge
In the competitive landscape of the U.S. stock market, Lennox International Inc. and Expeditors International of Washington, Inc. have showcased intriguing gross profit trends over the past decade. From 2014 to 2023, Lennox International Inc. demonstrated a steady upward trajectory, culminating in a remarkable 71% increase in gross profit by 2023. Meanwhile, Expeditors International experienced a dramatic surge in 2021, with profits more than doubling compared to 2020, before stabilizing in 2023.
These trends highlight the resilience and strategic prowess of these industry leaders, offering valuable insights for investors and market analysts alike.
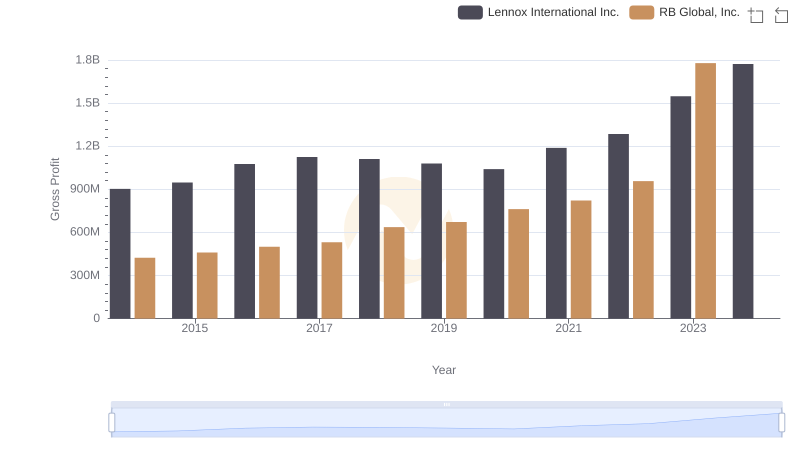
Lennox International Inc. vs RB Global, Inc.: A Gross Profit Performance Breakdown
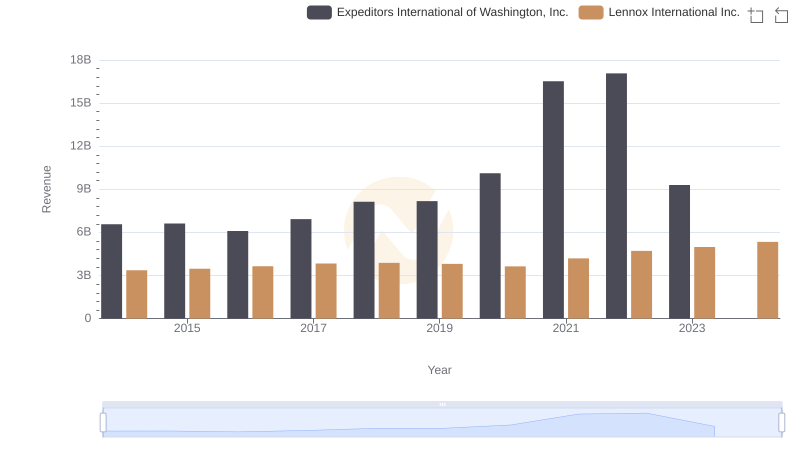
Lennox International Inc. vs Expeditors International of Washington, Inc.: Examining Key Revenue Metrics
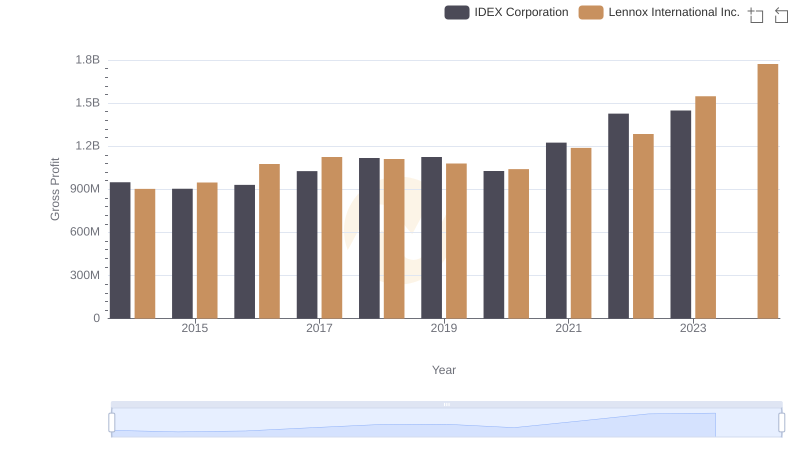
Gross Profit Comparison: Lennox International Inc. and IDEX Corporation Trends
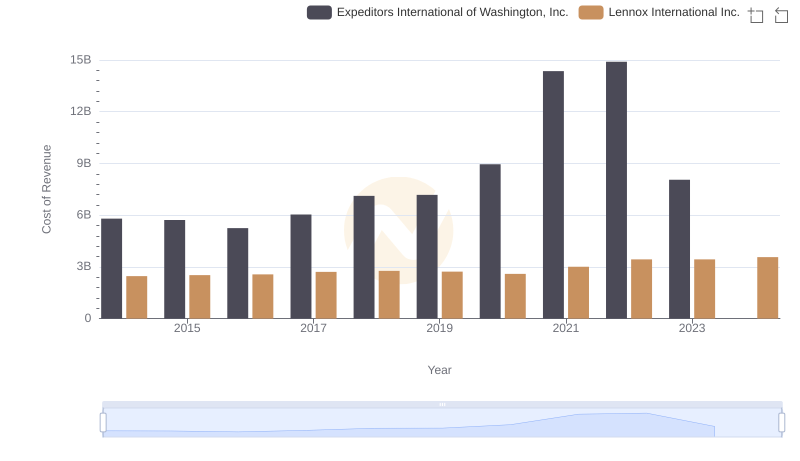
Cost Insights: Breaking Down Lennox International Inc. and Expeditors International of Washington, Inc.'s Expenses
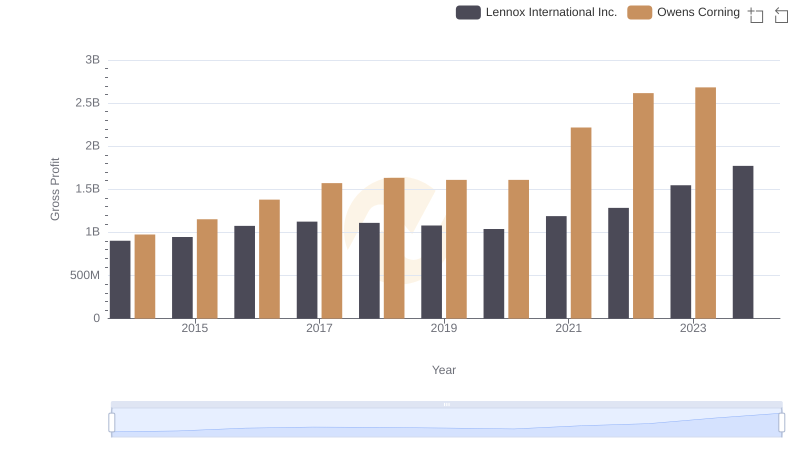
Gross Profit Analysis: Comparing Lennox International Inc. and Owens Corning
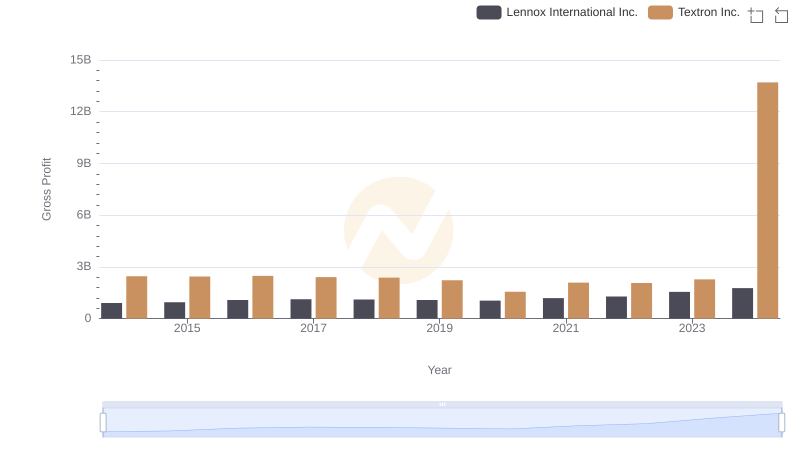
Gross Profit Comparison: Lennox International Inc. and Textron Inc. Trends
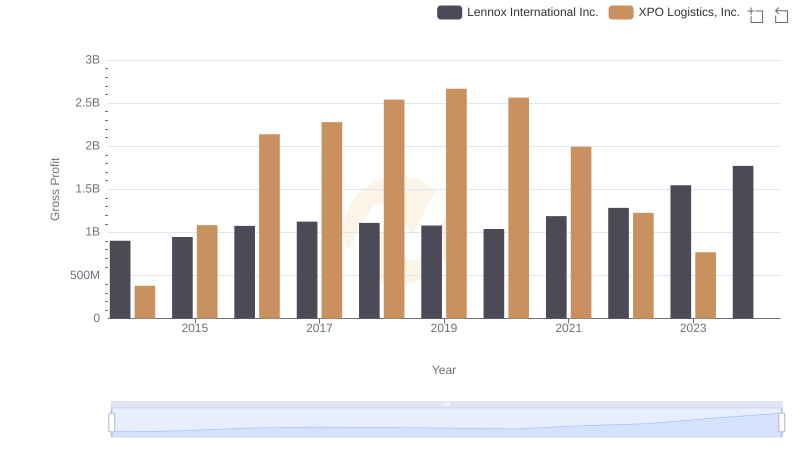
Gross Profit Comparison: Lennox International Inc. and XPO Logistics, Inc. Trends
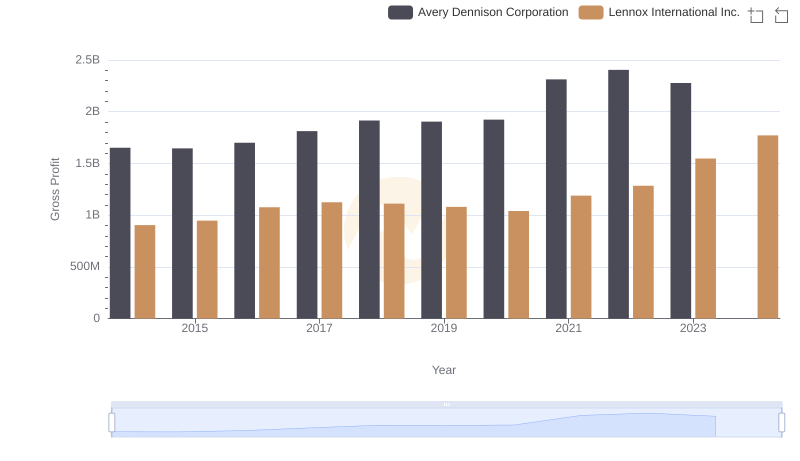
Gross Profit Analysis: Comparing Lennox International Inc. and Avery Dennison Corporation
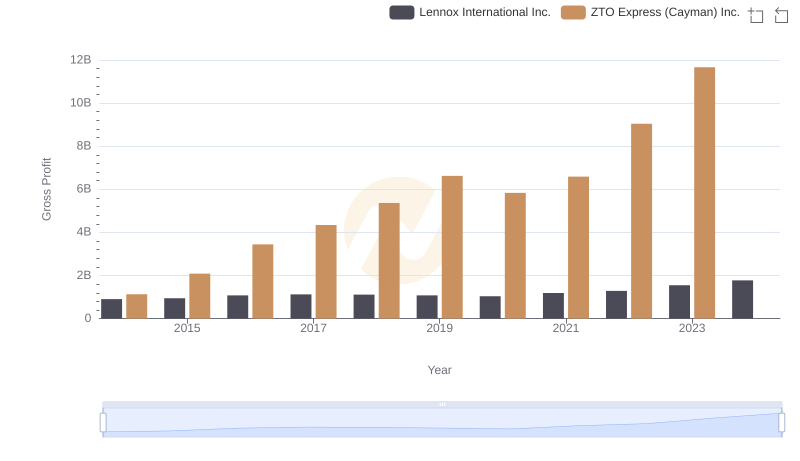
Gross Profit Comparison: Lennox International Inc. and ZTO Express (Cayman) Inc. Trends
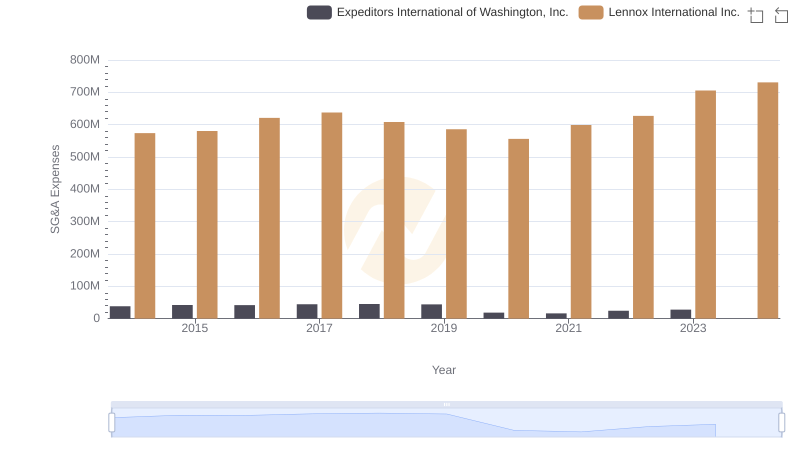
SG&A Efficiency Analysis: Comparing Lennox International Inc. and Expeditors International of Washington, Inc.
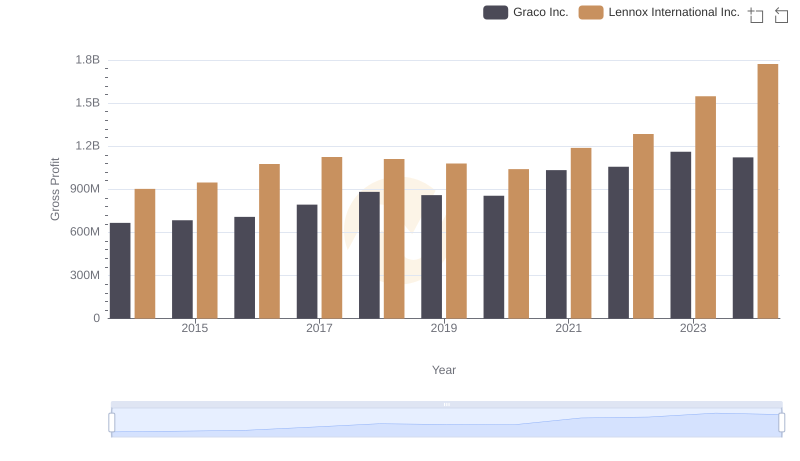
Lennox International Inc. and Graco Inc.: A Detailed Gross Profit Analysis
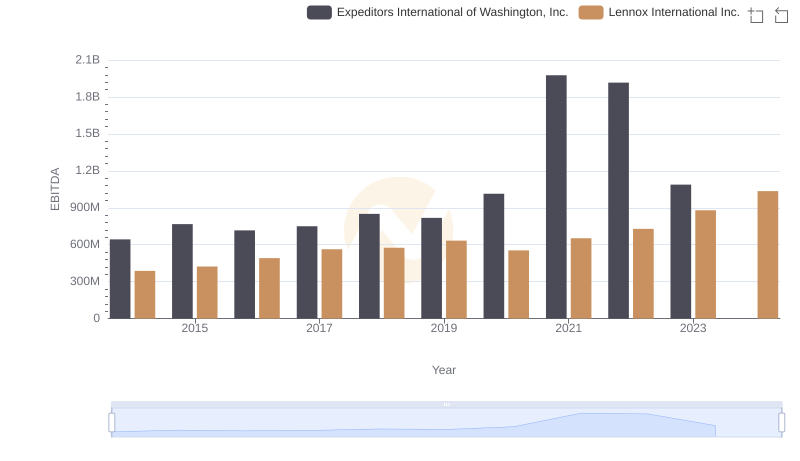
Lennox International Inc. and Expeditors International of Washington, Inc.: A Detailed Examination of EBITDA Performance