| __timestamp | Expeditors International of Washington, Inc. | Lennox International Inc. |
|---|---|---|
| Wednesday, January 1, 2014 | 38125000 | 573700000 |
| Thursday, January 1, 2015 | 41990000 | 580500000 |
| Friday, January 1, 2016 | 41763000 | 621000000 |
| Sunday, January 1, 2017 | 44290000 | 637700000 |
| Monday, January 1, 2018 | 45346000 | 608200000 |
| Tuesday, January 1, 2019 | 44002000 | 585900000 |
| Wednesday, January 1, 2020 | 18436000 | 555900000 |
| Friday, January 1, 2021 | 16026000 | 598900000 |
| Saturday, January 1, 2022 | 24293000 | 627200000 |
| Sunday, January 1, 2023 | 27913000 | 705500000 |
| Monday, January 1, 2024 | 33331000 | 730600000 |
Unlocking the unknown
In the competitive landscape of corporate America, managing Selling, General, and Administrative (SG&A) expenses is crucial for maintaining profitability. Lennox International Inc. and Expeditors International of Washington, Inc. offer a fascinating study in contrasts over the past decade.
From 2014 to 2023, Lennox International Inc. consistently reported higher SG&A expenses, peaking at approximately $730 million in 2023. This represents a 27% increase from 2014, reflecting strategic investments in growth and operations. In contrast, Expeditors International's SG&A expenses fluctuated, with a notable dip in 2020, likely due to pandemic-related cost-cutting measures. By 2023, their expenses rebounded to around $28 million, a 27% decrease from their 2014 peak.
These trends highlight differing strategic priorities: Lennox's steady increase suggests a focus on expansion, while Expeditors' variability indicates adaptive cost management. Understanding these dynamics is key for investors and analysts seeking to gauge corporate efficiency and strategic direction.
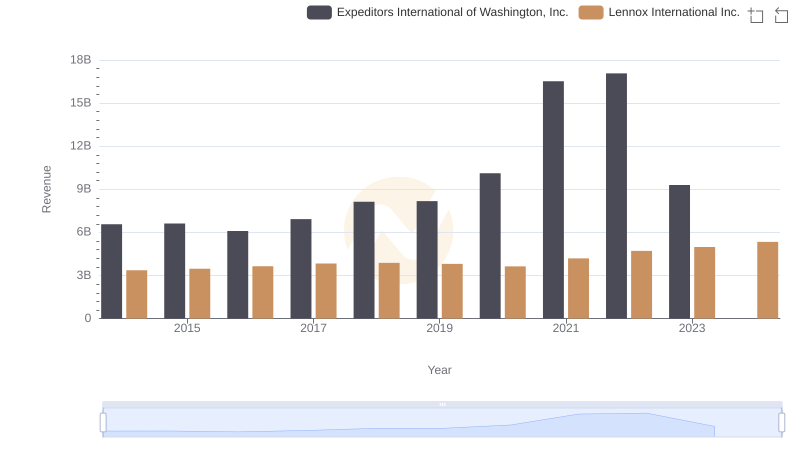
Lennox International Inc. vs Expeditors International of Washington, Inc.: Examining Key Revenue Metrics
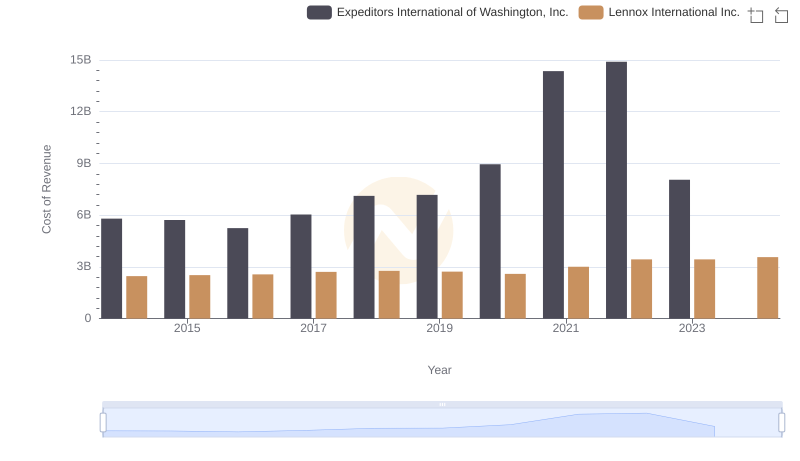
Cost Insights: Breaking Down Lennox International Inc. and Expeditors International of Washington, Inc.'s Expenses
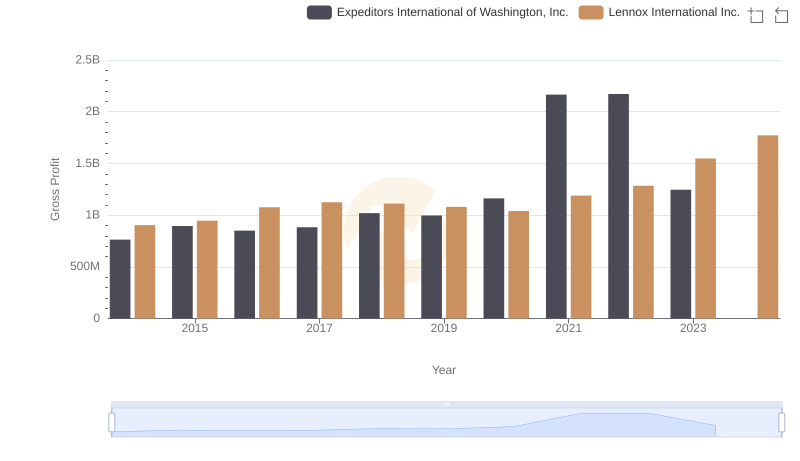
Gross Profit Trends Compared: Lennox International Inc. vs Expeditors International of Washington, Inc.
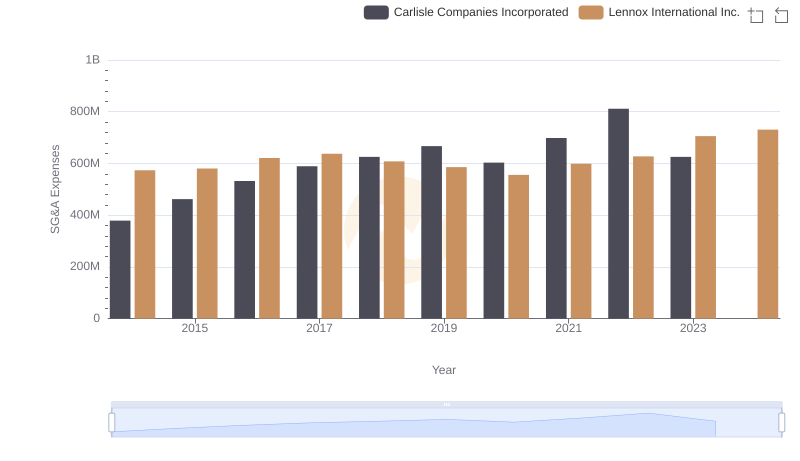
Selling, General, and Administrative Costs: Lennox International Inc. vs Carlisle Companies Incorporated
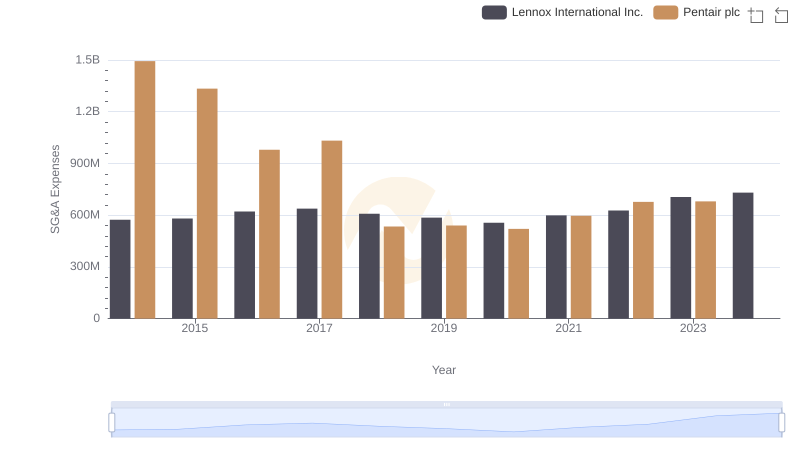
Lennox International Inc. and Pentair plc: SG&A Spending Patterns Compared
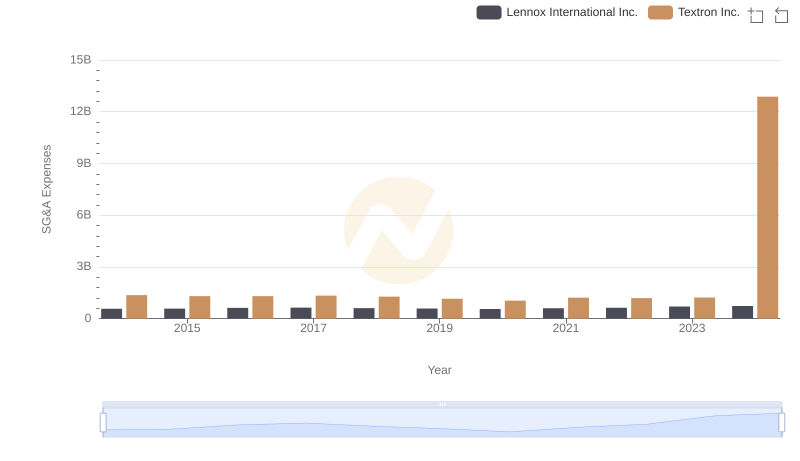
Lennox International Inc. or Textron Inc.: Who Manages SG&A Costs Better?
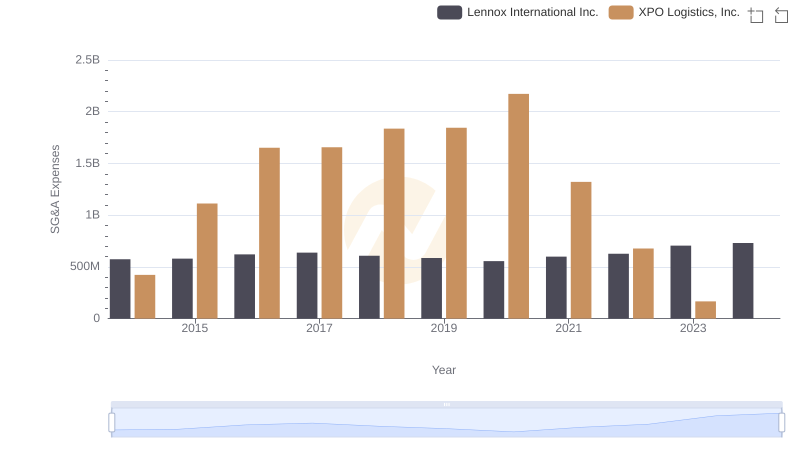
Lennox International Inc. vs XPO Logistics, Inc.: SG&A Expense Trends
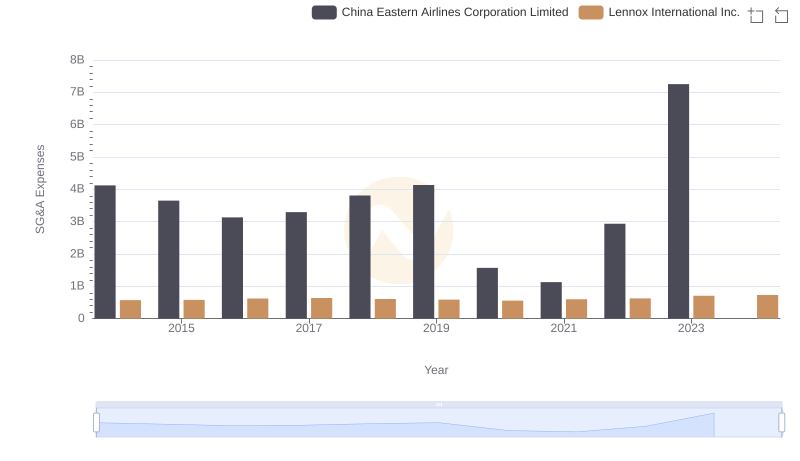
Lennox International Inc. and China Eastern Airlines Corporation Limited: SG&A Spending Patterns Compared
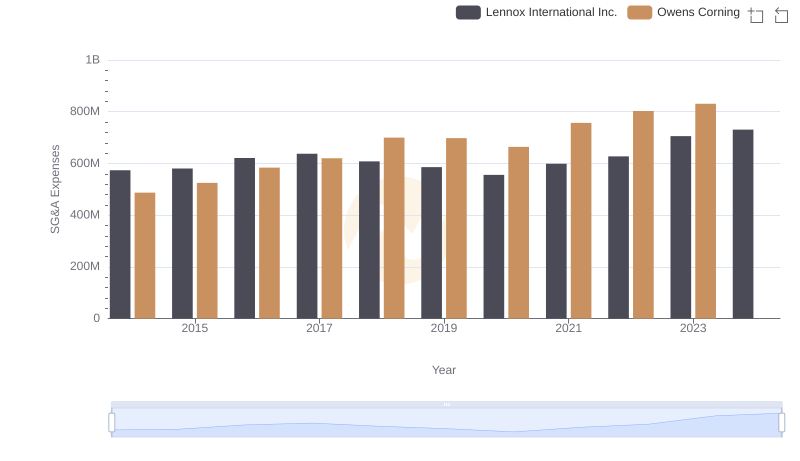
Lennox International Inc. or Owens Corning: Who Manages SG&A Costs Better?
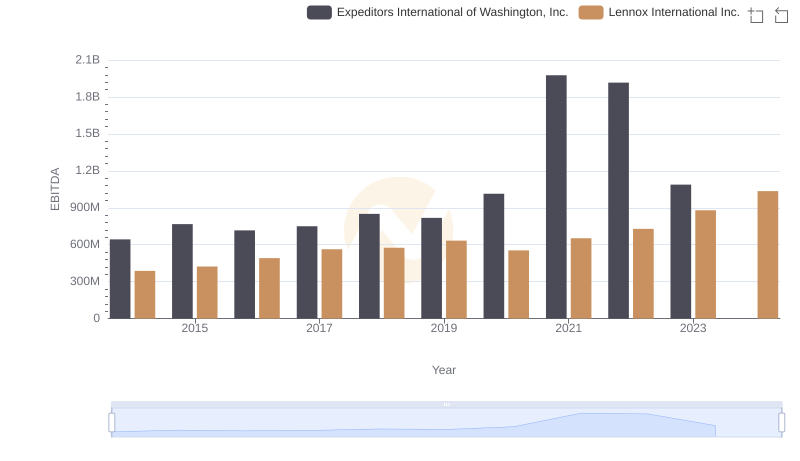
Lennox International Inc. and Expeditors International of Washington, Inc.: A Detailed Examination of EBITDA Performance
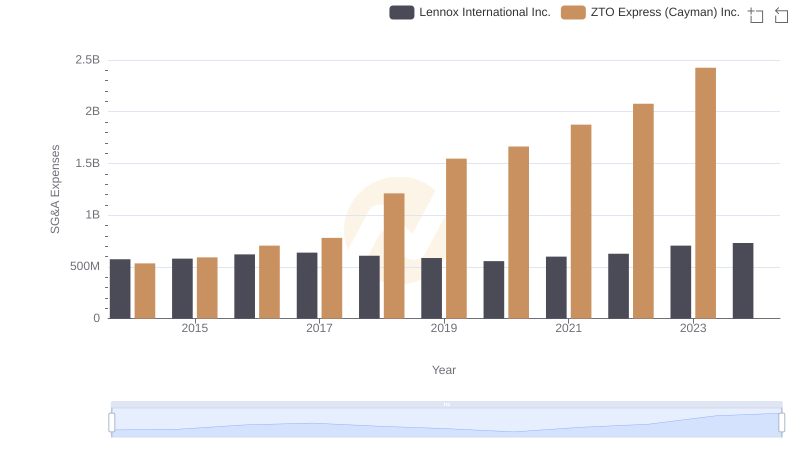
Operational Costs Compared: SG&A Analysis of Lennox International Inc. and ZTO Express (Cayman) Inc.
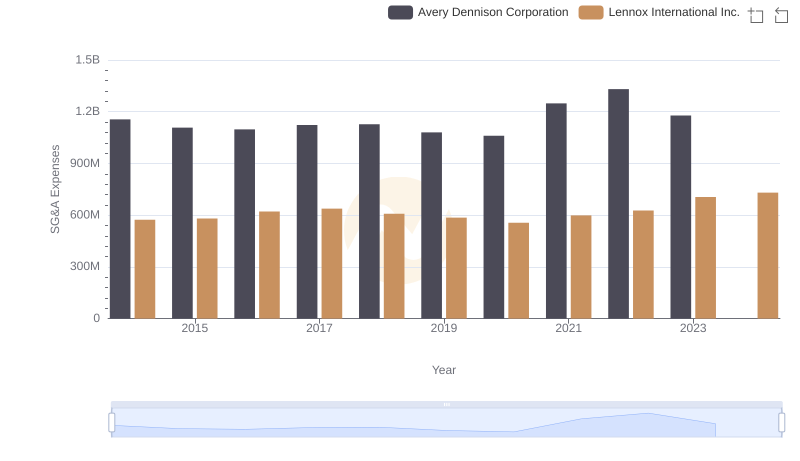
Operational Costs Compared: SG&A Analysis of Lennox International Inc. and Avery Dennison Corporation