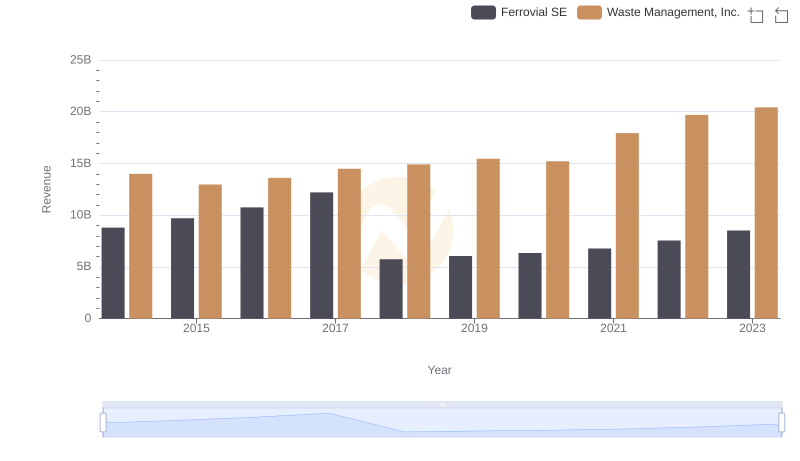
| __timestamp | Ferrovial SE | Waste Management, Inc. |
|---|---|---|
| Wednesday, January 1, 2014 | 1131000000 | 9002000000 |
| Thursday, January 1, 2015 | 1143000000 | 8231000000 |
| Friday, January 1, 2016 | 1267000000 | 8486000000 |
| Sunday, January 1, 2017 | 1345000000 | 9021000000 |
| Monday, January 1, 2018 | 985000000 | 9249000000 |
| Tuesday, January 1, 2019 | 949000000 | 9496000000 |
| Wednesday, January 1, 2020 | 1005000000 | 9341000000 |
| Friday, January 1, 2021 | 1077000000 | 11111000000 |
| Saturday, January 1, 2022 | 1197000000 | 12294000000 |
| Sunday, January 1, 2023 | 1129000000 | 12606000000 |
| Monday, January 1, 2024 | 13383000000 |
Infusing magic into the data realm
In the ever-evolving landscape of global waste management, two titans stand out: Waste Management, Inc. and Ferrovial SE. Over the past decade, these companies have showcased contrasting trajectories in their cost of revenue. Waste Management, Inc., a leader in North America, has seen its cost of revenue rise by approximately 40% from 2014 to 2023, reflecting its expanding operations and market dominance. In contrast, Ferrovial SE, a European powerhouse, experienced a more modest fluctuation, with a peak in 2017 and a subsequent stabilization.
These trends underscore the diverse strategies employed by these industry leaders in navigating the challenges of the waste management sector.
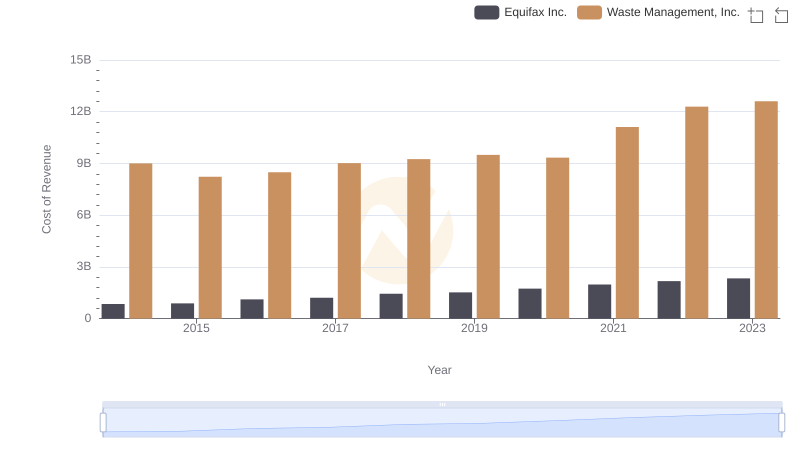
Comparing Cost of Revenue Efficiency: Waste Management, Inc. vs Equifax Inc.
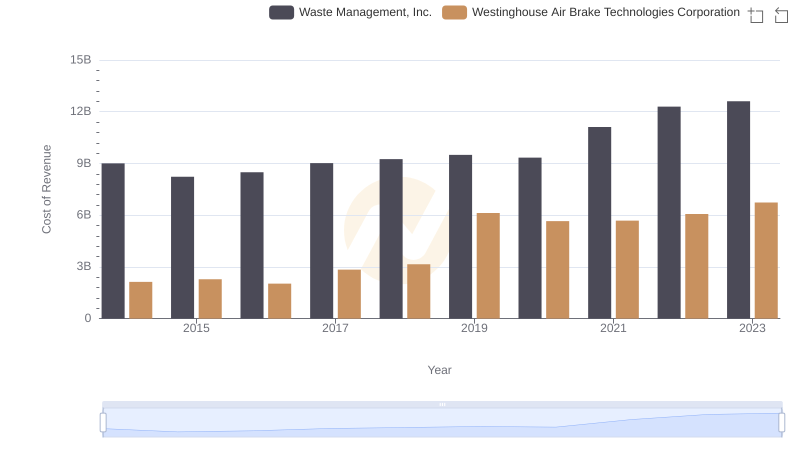
Cost of Revenue Comparison: Waste Management, Inc. vs Westinghouse Air Brake Technologies Corporation
Waste Management, Inc. or Ferrovial SE: Who Leads in Yearly Revenue?
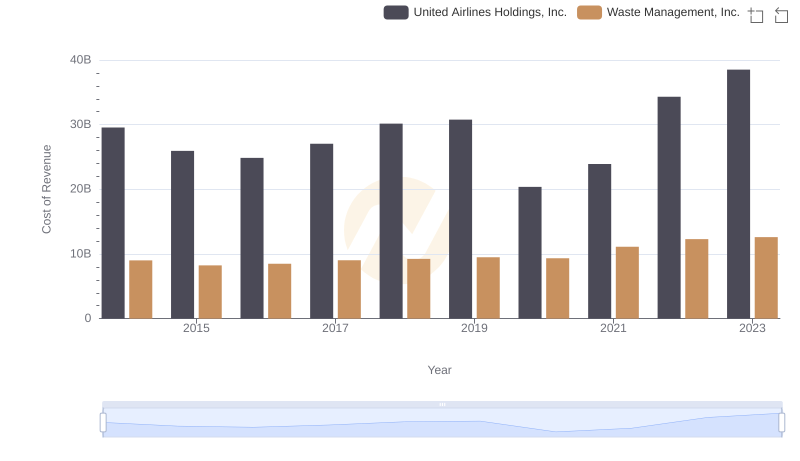
Cost Insights: Breaking Down Waste Management, Inc. and United Airlines Holdings, Inc.'s Expenses
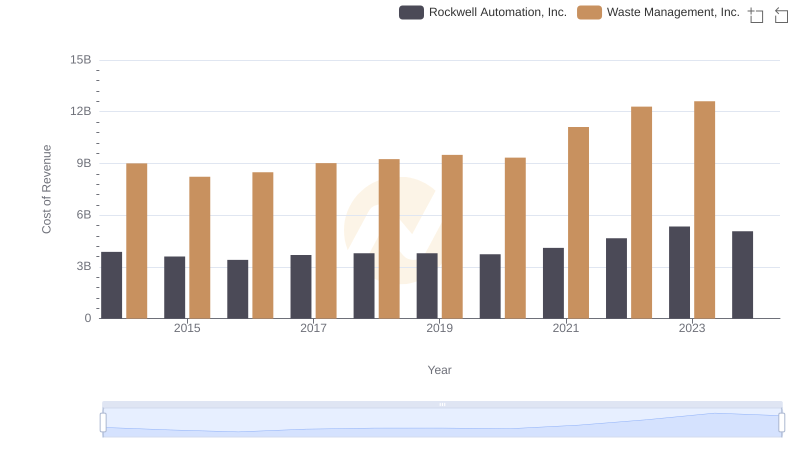
Cost of Revenue: Key Insights for Waste Management, Inc. and Rockwell Automation, Inc.
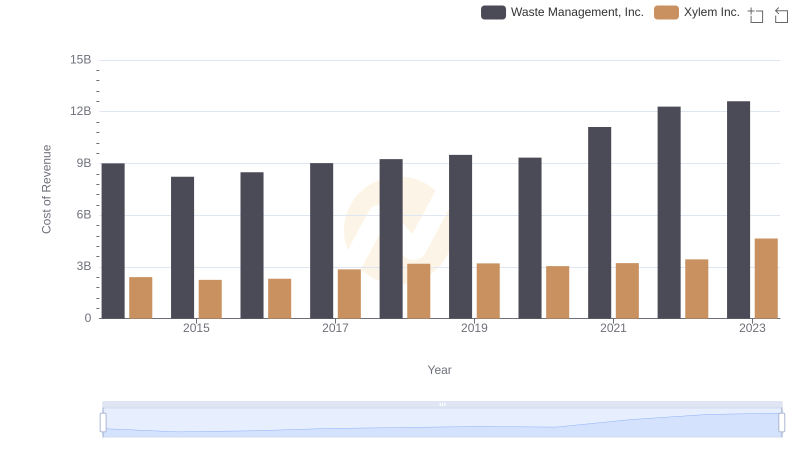
Cost of Revenue: Key Insights for Waste Management, Inc. and Xylem Inc.
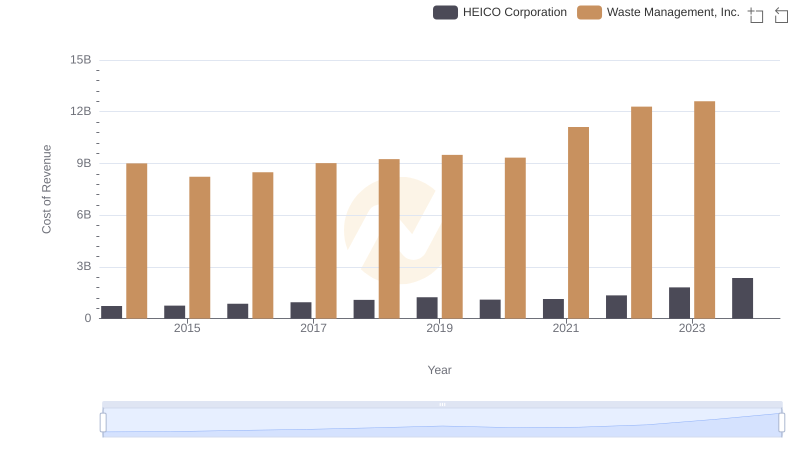
Comparing Cost of Revenue Efficiency: Waste Management, Inc. vs HEICO Corporation
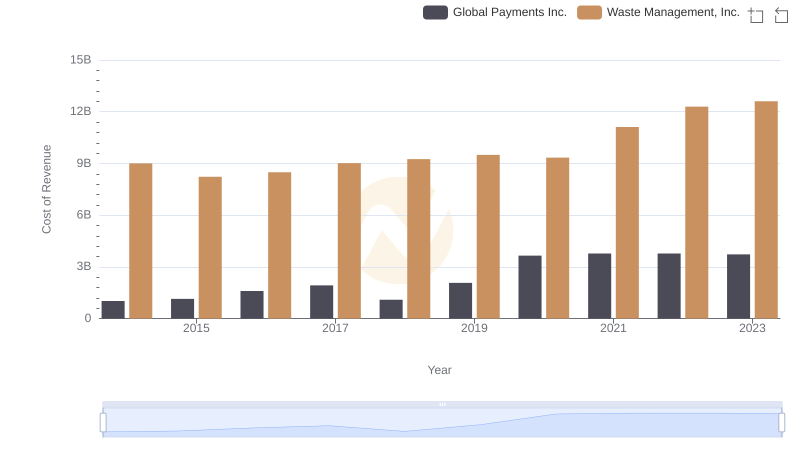
Cost of Revenue Trends: Waste Management, Inc. vs Global Payments Inc.
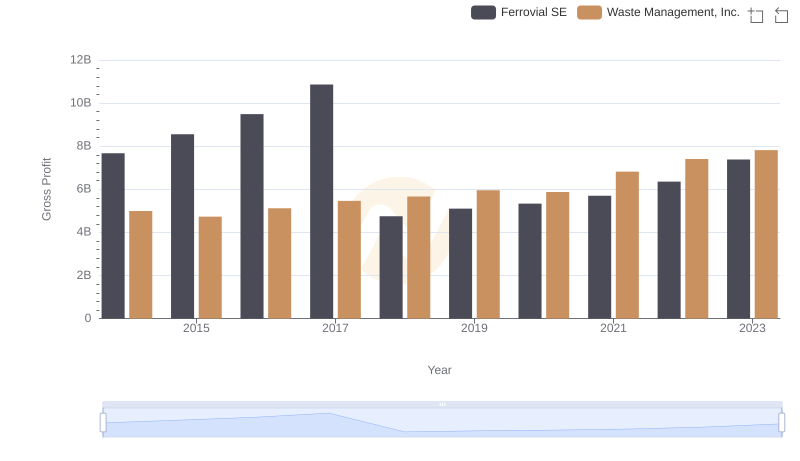
Key Insights on Gross Profit: Waste Management, Inc. vs Ferrovial SE
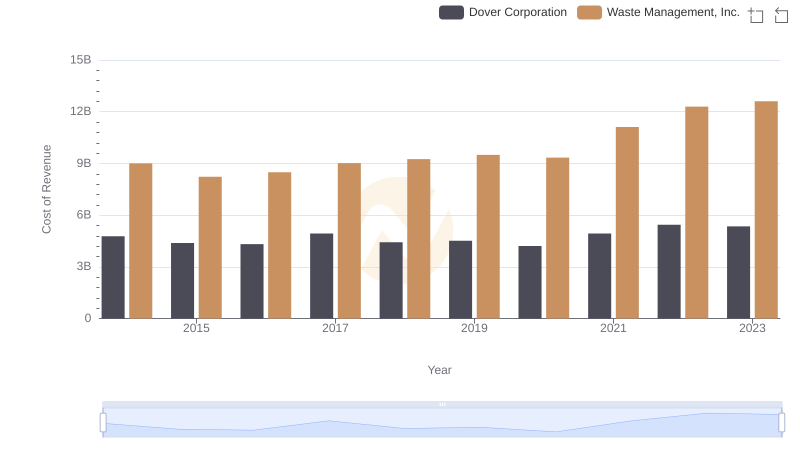
Comparing Cost of Revenue Efficiency: Waste Management, Inc. vs Dover Corporation
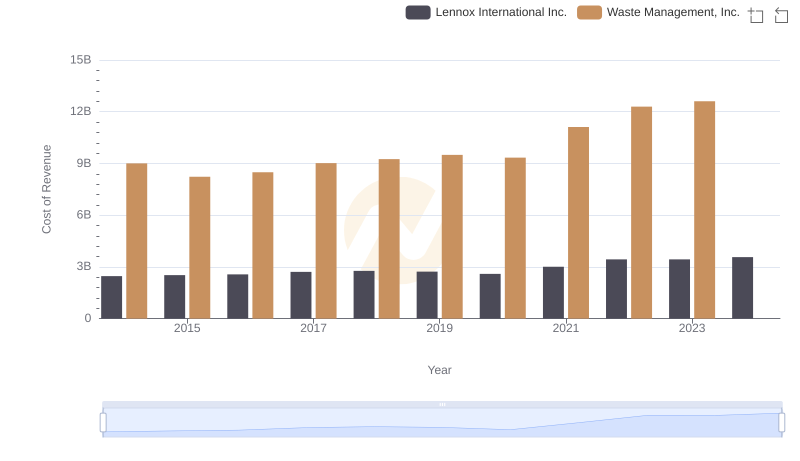
Cost Insights: Breaking Down Waste Management, Inc. and Lennox International Inc.'s Expenses
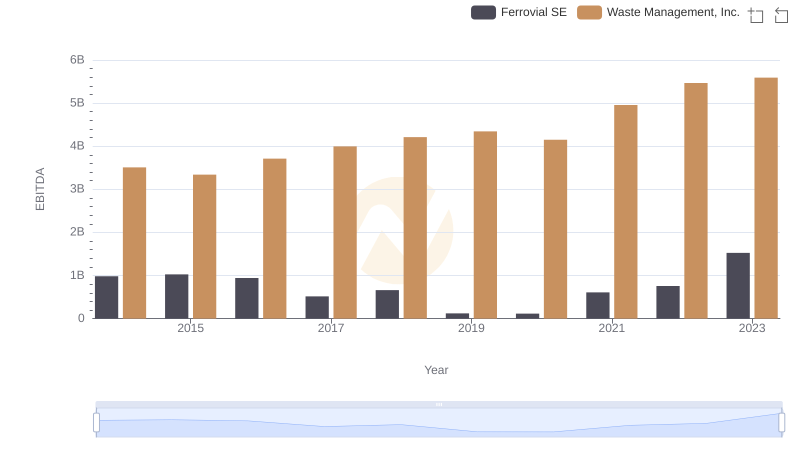
Waste Management, Inc. vs Ferrovial SE: In-Depth EBITDA Performance Comparison