| __timestamp | Ferrovial SE | Waste Management, Inc. |
|---|---|---|
| Wednesday, January 1, 2014 | 983000000 | 3509000000 |
| Thursday, January 1, 2015 | 1027000000 | 3342000000 |
| Friday, January 1, 2016 | 943000000 | 3713000000 |
| Sunday, January 1, 2017 | 515000000 | 3996000000 |
| Monday, January 1, 2018 | 661000000 | 4212000000 |
| Tuesday, January 1, 2019 | 121000000 | 4344000000 |
| Wednesday, January 1, 2020 | 116000000 | 4149000000 |
| Friday, January 1, 2021 | 610000000 | 4956000000 |
| Saturday, January 1, 2022 | 756000000 | 5466000000 |
| Sunday, January 1, 2023 | 1524000000 | 5592000000 |
| Monday, January 1, 2024 | 5128000000 |
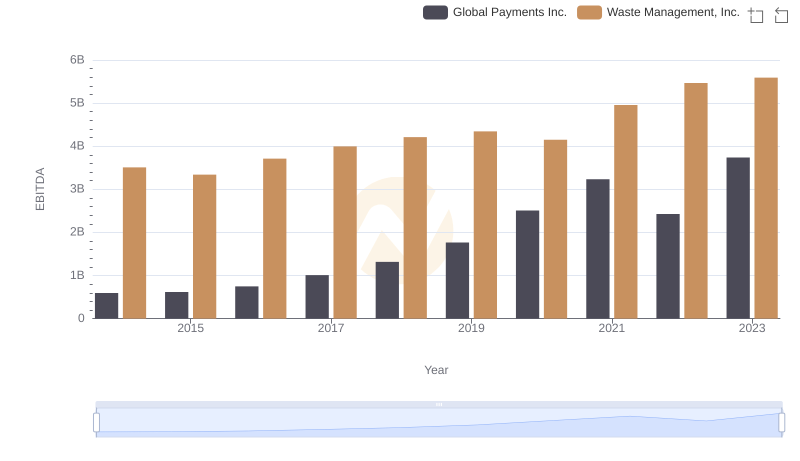
Cracking the code
In the world of environmental services, Waste Management, Inc. and Ferrovial SE stand as titans. Over the past decade, their EBITDA performance has painted a vivid picture of resilience and growth. Waste Management, Inc. has consistently outperformed, with its EBITDA growing by approximately 60% from 2014 to 2023. In contrast, Ferrovial SE experienced a more volatile journey, with a notable surge in 2023, reaching its highest EBITDA in the decade.
This comparison not only highlights the strategic prowess of these companies but also underscores the dynamic nature of the global waste management industry.
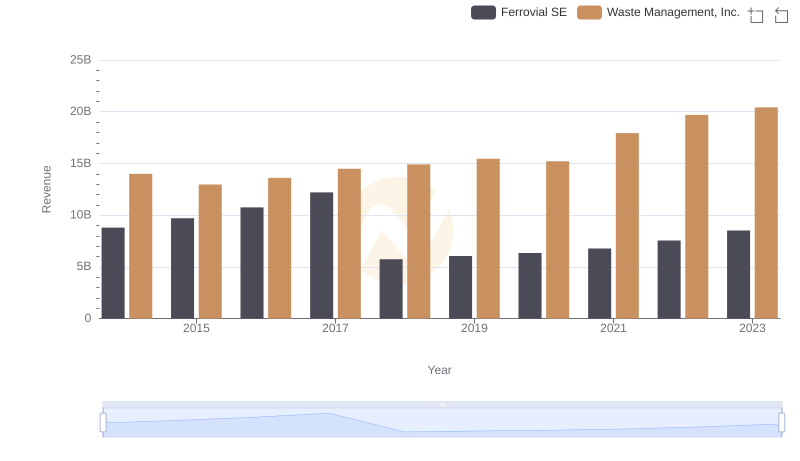
Waste Management, Inc. or Ferrovial SE: Who Leads in Yearly Revenue?
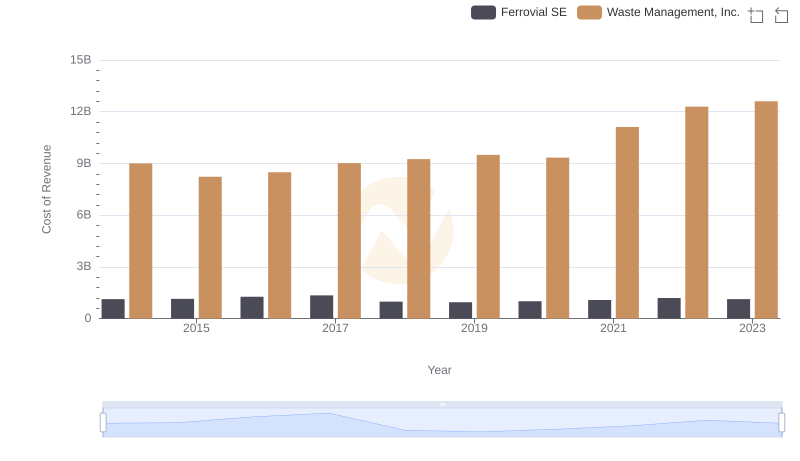
Cost of Revenue Comparison: Waste Management, Inc. vs Ferrovial SE
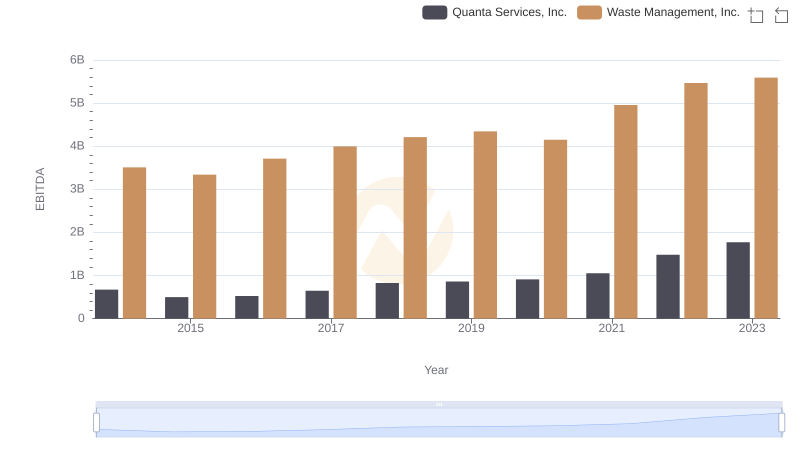
Professional EBITDA Benchmarking: Waste Management, Inc. vs Quanta Services, Inc.
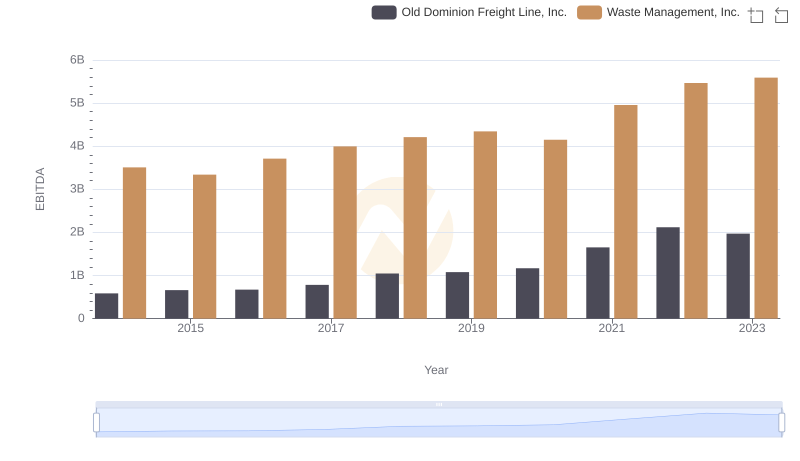
A Professional Review of EBITDA: Waste Management, Inc. Compared to Old Dominion Freight Line, Inc.
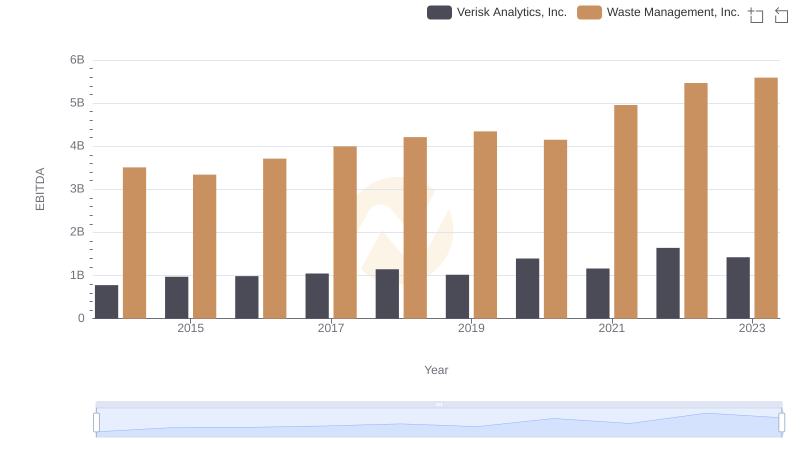
A Professional Review of EBITDA: Waste Management, Inc. Compared to Verisk Analytics, Inc.
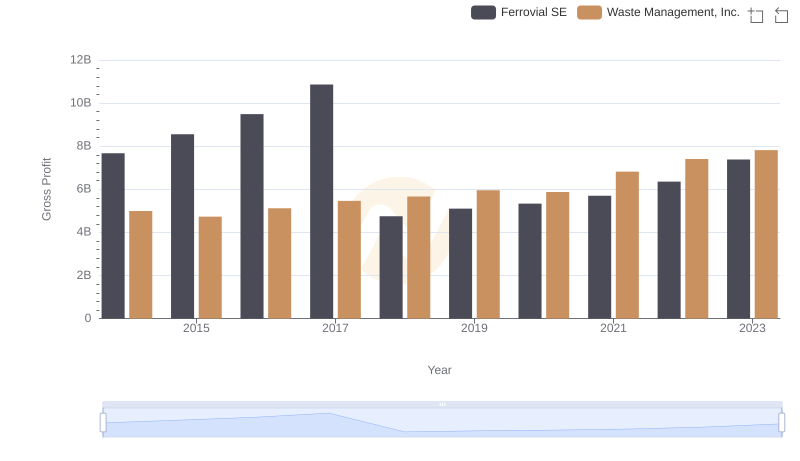
Key Insights on Gross Profit: Waste Management, Inc. vs Ferrovial SE
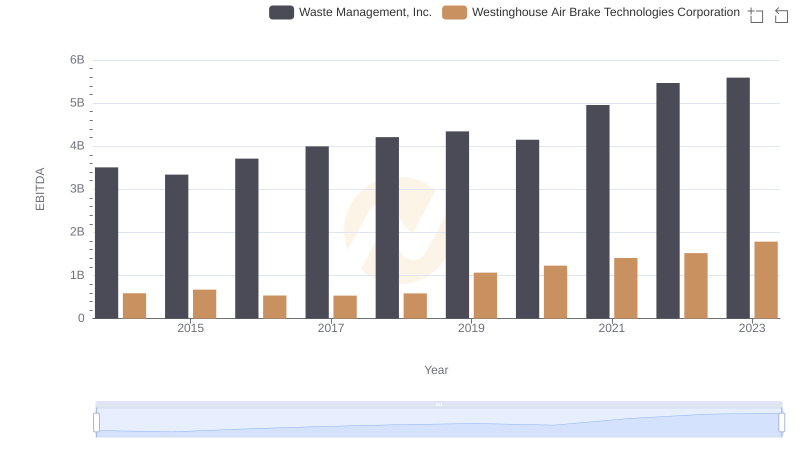
A Professional Review of EBITDA: Waste Management, Inc. Compared to Westinghouse Air Brake Technologies Corporation
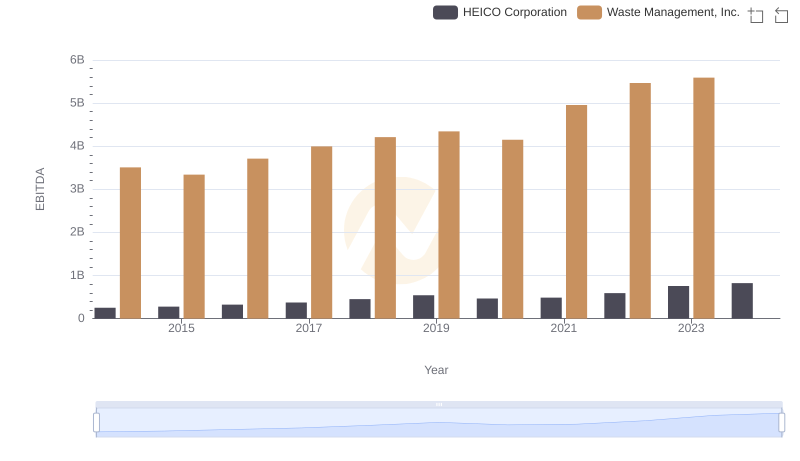
A Side-by-Side Analysis of EBITDA: Waste Management, Inc. and HEICO Corporation
A Professional Review of EBITDA: Waste Management, Inc. Compared to Global Payments Inc.