| __timestamp | Ferrovial SE | Waste Management, Inc. |
|---|---|---|
| Wednesday, January 1, 2014 | 8802000000 | 13996000000 |
| Thursday, January 1, 2015 | 9699000000 | 12961000000 |
| Friday, January 1, 2016 | 10758000000 | 13609000000 |
| Sunday, January 1, 2017 | 12209000000 | 14485000000 |
| Monday, January 1, 2018 | 5737000000 | 14914000000 |
| Tuesday, January 1, 2019 | 6054000000 | 15455000000 |
| Wednesday, January 1, 2020 | 6341000000 | 15218000000 |
| Friday, January 1, 2021 | 6778000000 | 17931000000 |
| Saturday, January 1, 2022 | 7551000000 | 19698000000 |
| Sunday, January 1, 2023 | 8514000000 | 20426000000 |
| Monday, January 1, 2024 | 22063000000 |
Data in motion
In the ever-evolving landscape of global waste management, two giants have emerged as leaders: Waste Management, Inc. and Ferrovial SE. Over the past decade, from 2014 to 2023, these companies have been in a fierce competition to dominate the industry. Waste Management, Inc. has consistently outperformed Ferrovial SE, boasting an average annual revenue of approximately $15.9 billion, nearly double that of Ferrovial SE's $8.2 billion.
This data underscores the dynamic nature of the waste management sector, where strategic innovation and market adaptation are key to maintaining leadership.
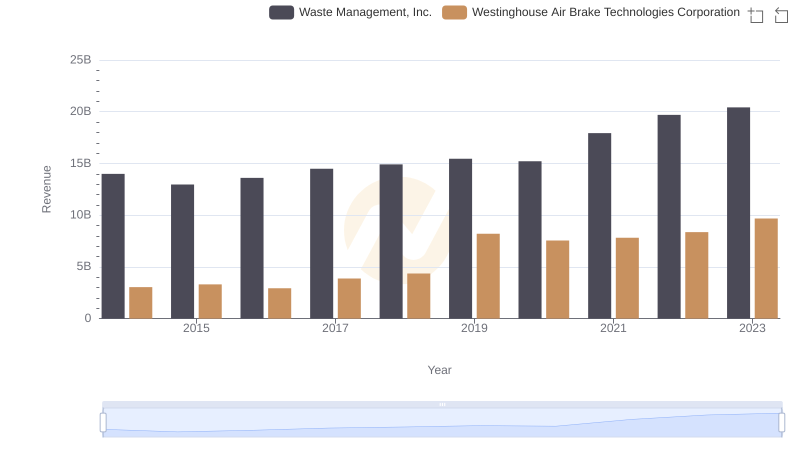
Revenue Showdown: Waste Management, Inc. vs Westinghouse Air Brake Technologies Corporation
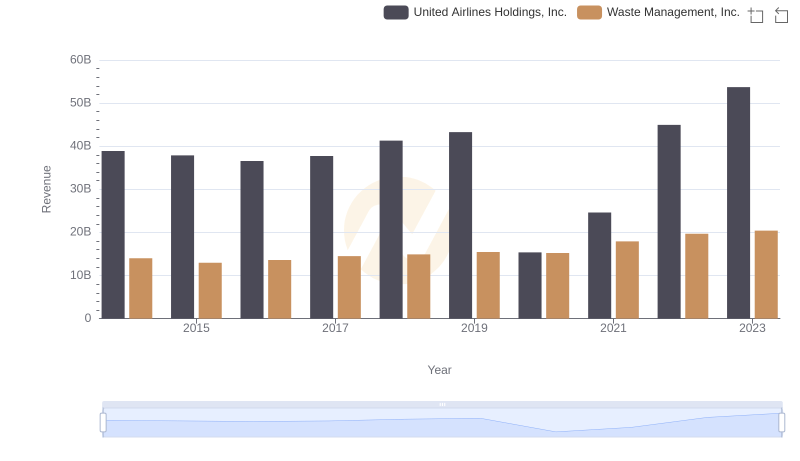
Waste Management, Inc. and United Airlines Holdings, Inc.: A Comprehensive Revenue Analysis
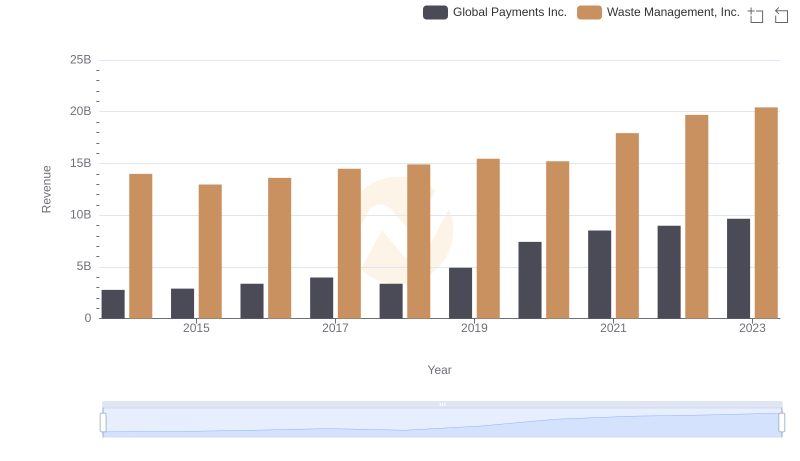
Revenue Showdown: Waste Management, Inc. vs Global Payments Inc.
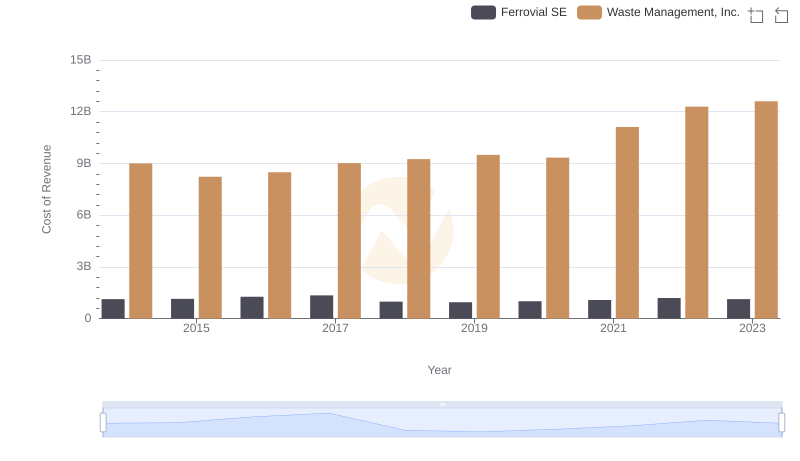
Cost of Revenue Comparison: Waste Management, Inc. vs Ferrovial SE

Breaking Down Revenue Trends: Waste Management, Inc. vs Lennox International Inc.
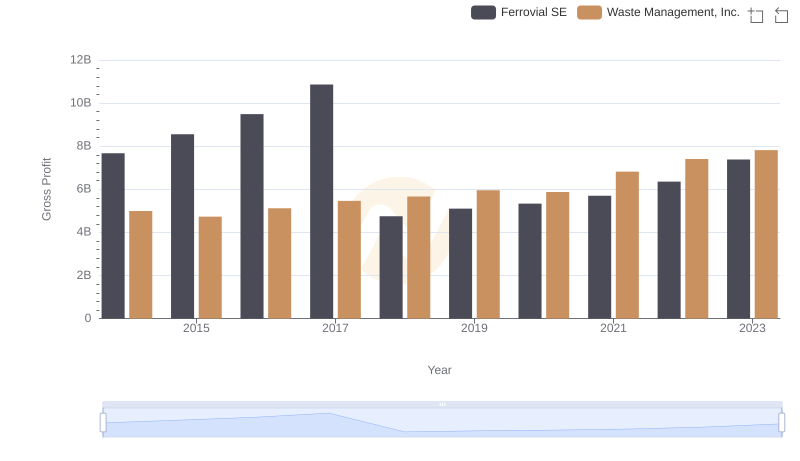
Key Insights on Gross Profit: Waste Management, Inc. vs Ferrovial SE
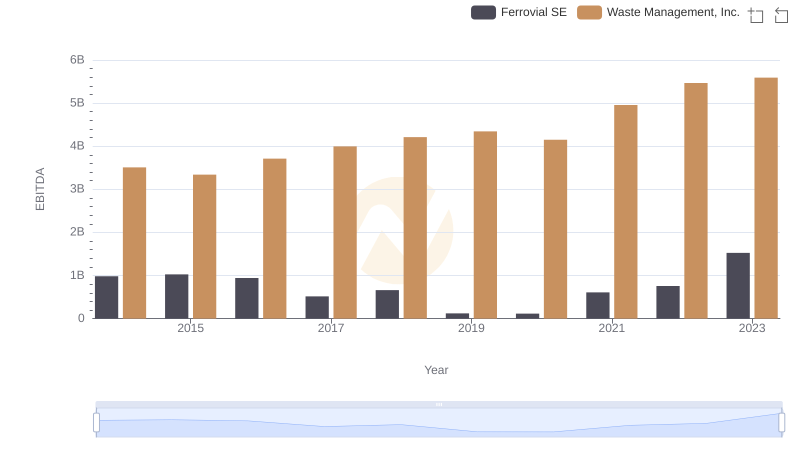
Waste Management, Inc. vs Ferrovial SE: In-Depth EBITDA Performance Comparison