| __timestamp | Cadence Design Systems, Inc. | Intuit Inc. |
|---|---|---|
| Wednesday, January 1, 2014 | 223706000 | 668000000 |
| Thursday, January 1, 2015 | 238453000 | 725000000 |
| Friday, January 1, 2016 | 256492000 | 752000000 |
| Sunday, January 1, 2017 | 237390000 | 809000000 |
| Monday, January 1, 2018 | 258747000 | 977000000 |
| Tuesday, January 1, 2019 | 266357000 | 1167000000 |
| Wednesday, January 1, 2020 | 305498000 | 1378000000 |
| Friday, January 1, 2021 | 307006000 | 1683000000 |
| Saturday, January 1, 2022 | 371623000 | 2406000000 |
| Sunday, January 1, 2023 | 435041000 | 3143000000 |
| Monday, January 1, 2024 | 210902000 | 3465000000 |
Data in motion
In the ever-evolving landscape of technology, Intuit Inc. and Cadence Design Systems, Inc. have carved out significant niches. Over the past decade, from 2014 to 2023, these companies have shown distinct trends in their cost of revenue, a critical metric reflecting the direct costs attributable to the production of goods sold.
Intuit Inc. has seen a remarkable increase, with its cost of revenue growing by approximately 370% from 2014 to 2023. This surge underscores Intuit's expanding operations and market reach. In contrast, Cadence Design Systems, Inc. experienced a more modest growth of around 95% over the same period, indicating steady but less aggressive expansion.
Interestingly, while Intuit's cost of revenue continued to rise in 2024, Cadence's data for that year remains elusive, leaving room for speculation about its financial strategies. These trends offer a fascinating glimpse into the operational dynamics of these tech titans.
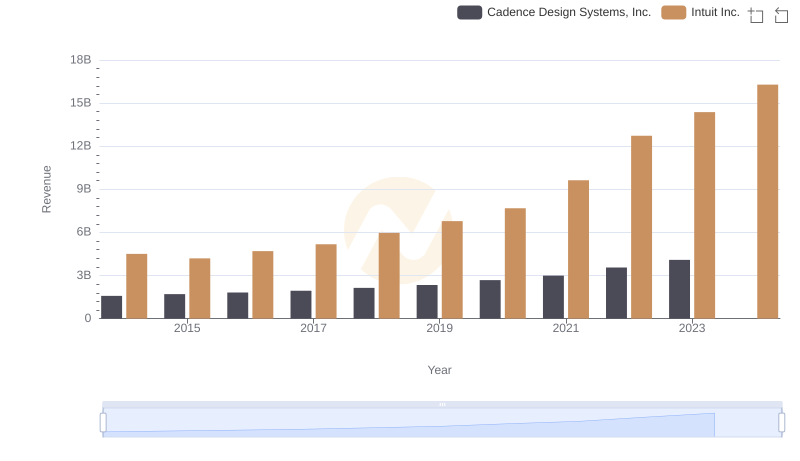
Who Generates More Revenue? Intuit Inc. or Cadence Design Systems, Inc.
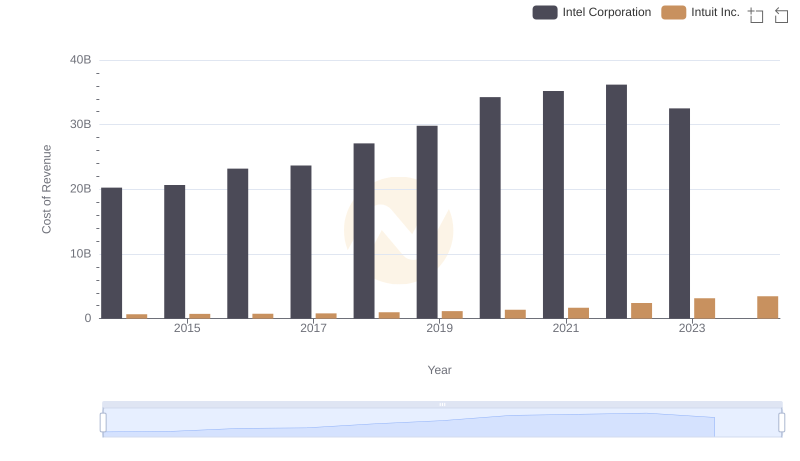
Intuit Inc. vs Intel Corporation: Efficiency in Cost of Revenue Explored
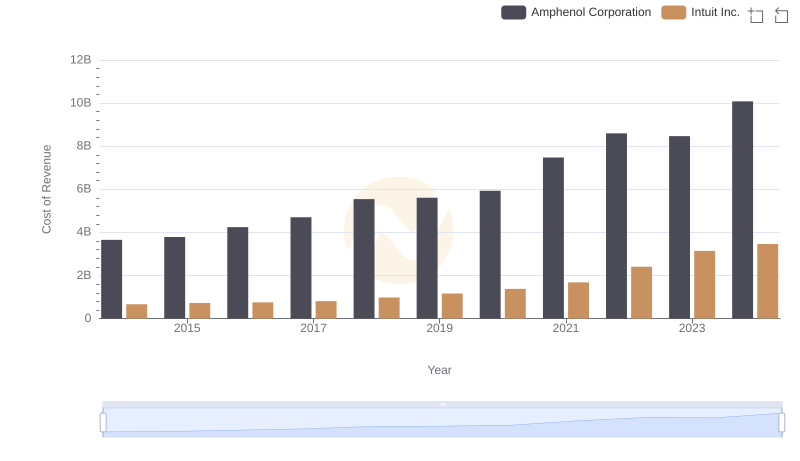
Analyzing Cost of Revenue: Intuit Inc. and Amphenol Corporation
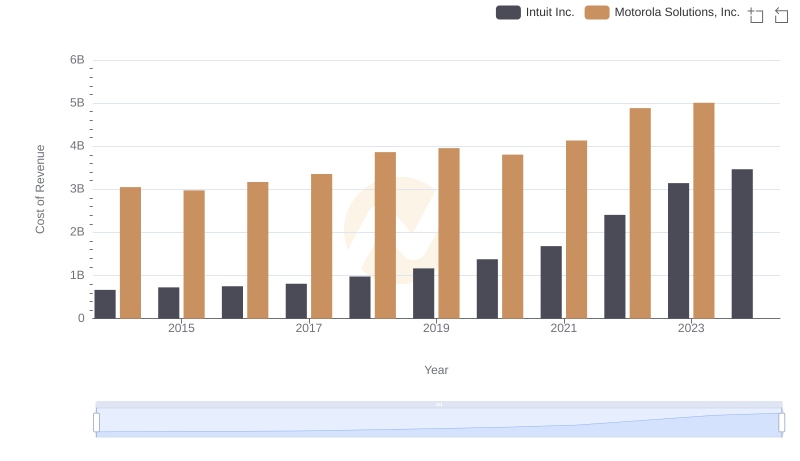
Cost Insights: Breaking Down Intuit Inc. and Motorola Solutions, Inc.'s Expenses
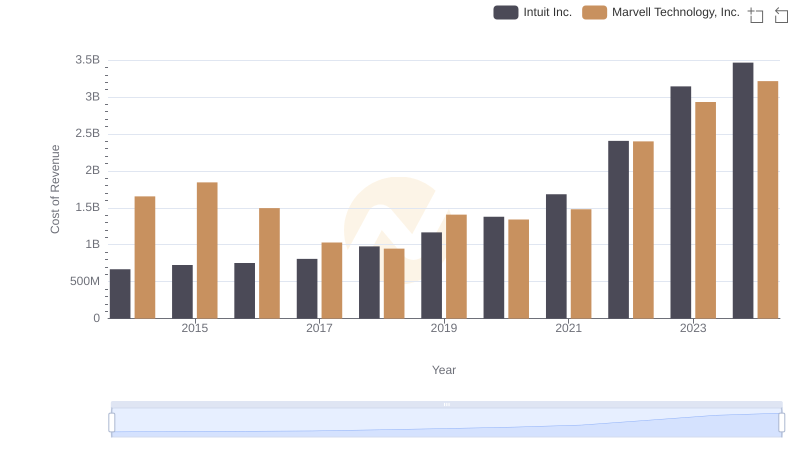
Cost of Revenue Comparison: Intuit Inc. vs Marvell Technology, Inc.
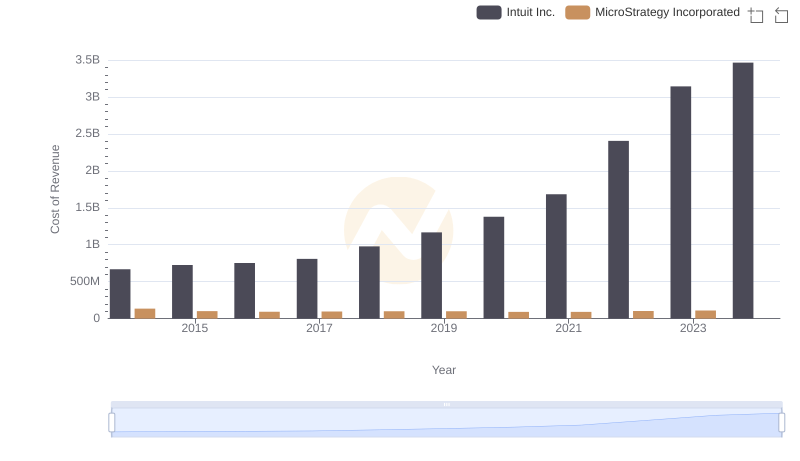
Analyzing Cost of Revenue: Intuit Inc. and MicroStrategy Incorporated
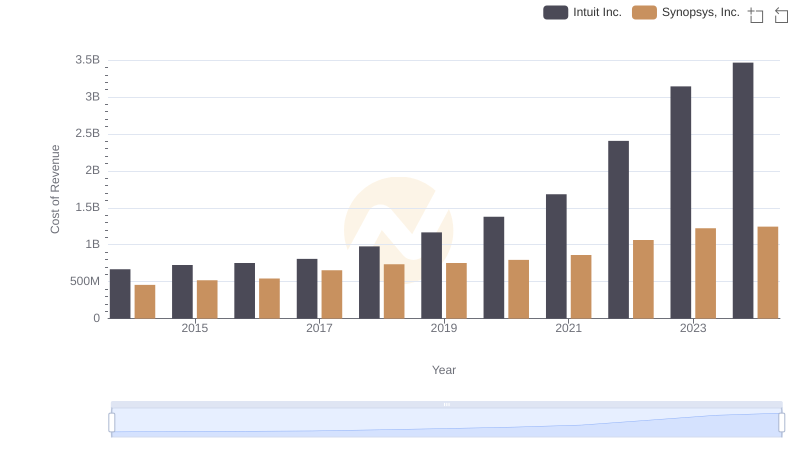
Comparing Cost of Revenue Efficiency: Intuit Inc. vs Synopsys, Inc.
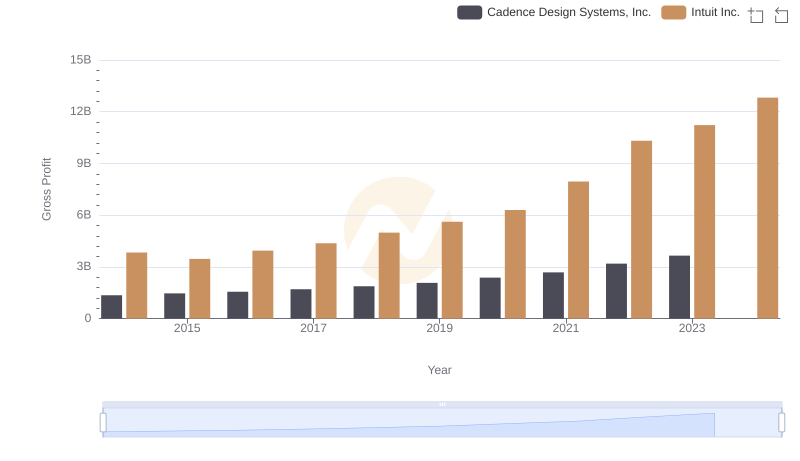
Key Insights on Gross Profit: Intuit Inc. vs Cadence Design Systems, Inc.
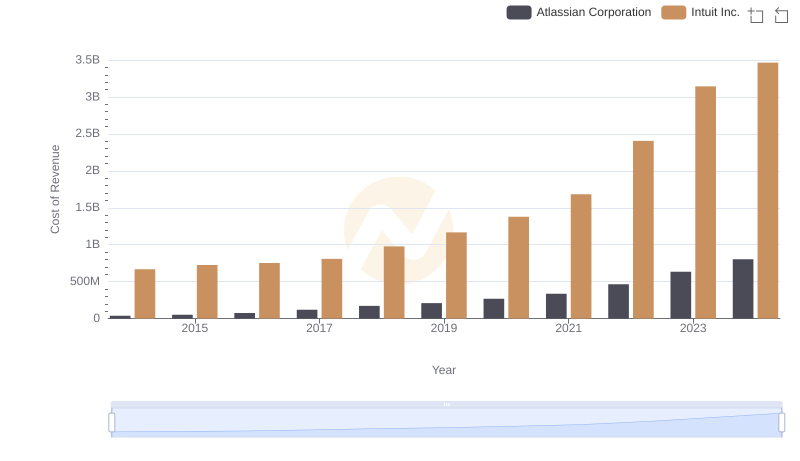
Analyzing Cost of Revenue: Intuit Inc. and Atlassian Corporation
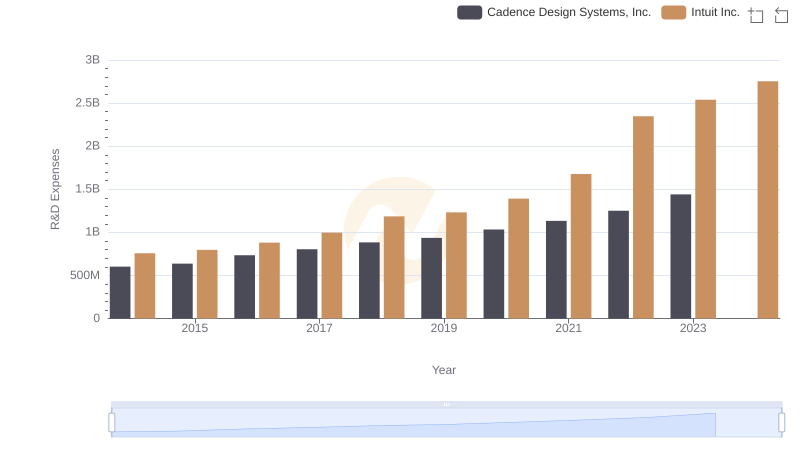
Comparing Innovation Spending: Intuit Inc. and Cadence Design Systems, Inc.
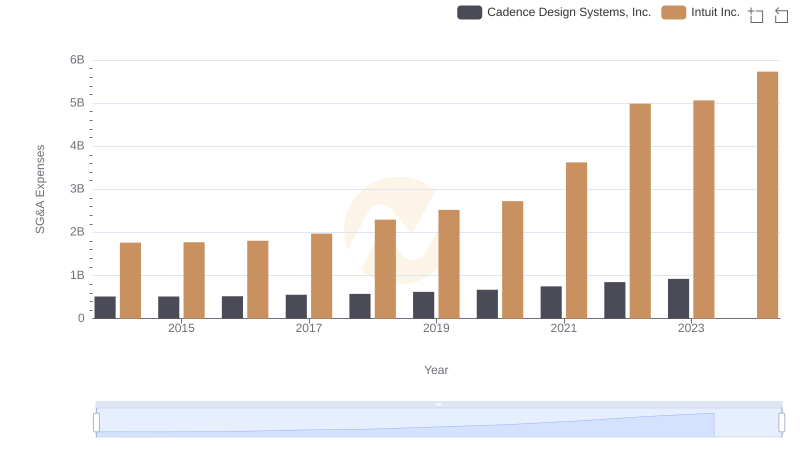
Operational Costs Compared: SG&A Analysis of Intuit Inc. and Cadence Design Systems, Inc.
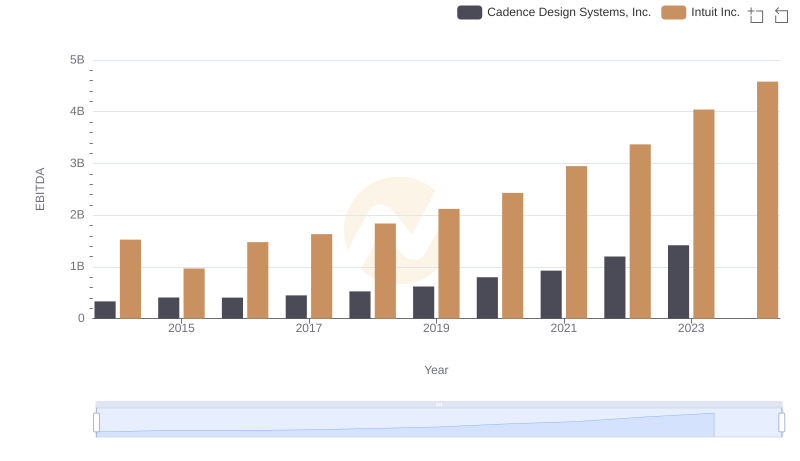
Comparative EBITDA Analysis: Intuit Inc. vs Cadence Design Systems, Inc.