| __timestamp | International Business Machines Corporation | The Trade Desk, Inc. |
|---|---|---|
| Wednesday, January 1, 2014 | 46407000000 | 31989000 |
| Thursday, January 1, 2015 | 40684000000 | 90869000 |
| Friday, January 1, 2016 | 38516000000 | 163050000 |
| Sunday, January 1, 2017 | 36943000000 | 241987000 |
| Monday, January 1, 2018 | 36936000000 | 363196000 |
| Tuesday, January 1, 2019 | 31533000000 | 504878000 |
| Wednesday, January 1, 2020 | 30865000000 | 657221000 |
| Friday, January 1, 2021 | 31486000000 | 974913000 |
| Saturday, January 1, 2022 | 32687000000 | 1296672000 |
| Sunday, January 1, 2023 | 34300000000 | 1580522000 |
| Monday, January 1, 2024 | 35551000000 | 1972819000 |
Unveiling the hidden dimensions of data
In the ever-evolving landscape of technology and advertising, International Business Machines Corporation (IBM) and The Trade Desk, Inc. stand as titans in their respective fields. Over the past decade, IBM's gross profit has seen a decline of approximately 26%, from a peak in 2014 to a low in 2021, reflecting the challenges faced by traditional tech giants in adapting to new market dynamics. Meanwhile, The Trade Desk, a leader in digital advertising, has experienced a meteoric rise, with its gross profit increasing nearly 50-fold from 2014 to 2023, showcasing the explosive growth of digital ad platforms.
Despite IBM's recent recovery, with a 9% increase in gross profit from 2021 to 2023, the data for 2024 remains incomplete, leaving room for speculation. This comparison highlights the shifting paradigms in technology and advertising, where agility and innovation are key to sustained success.
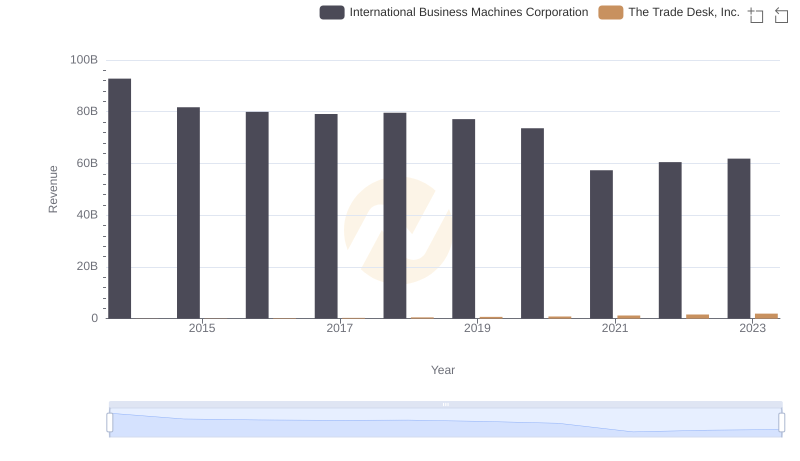
International Business Machines Corporation and The Trade Desk, Inc.: A Comprehensive Revenue Analysis
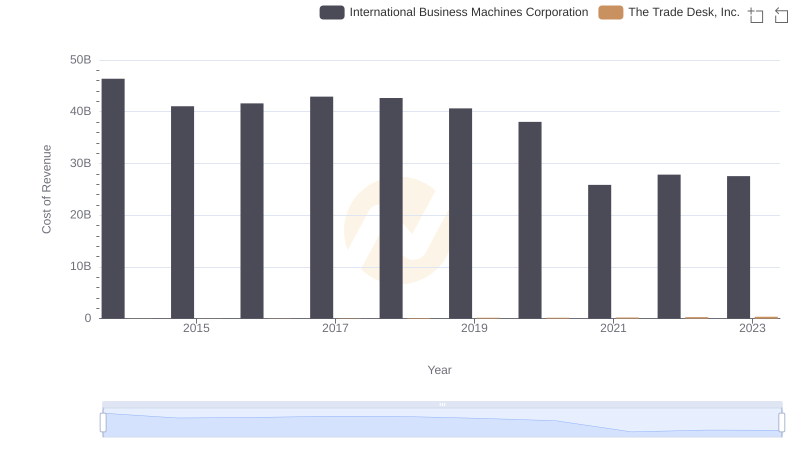
Cost Insights: Breaking Down International Business Machines Corporation and The Trade Desk, Inc.'s Expenses
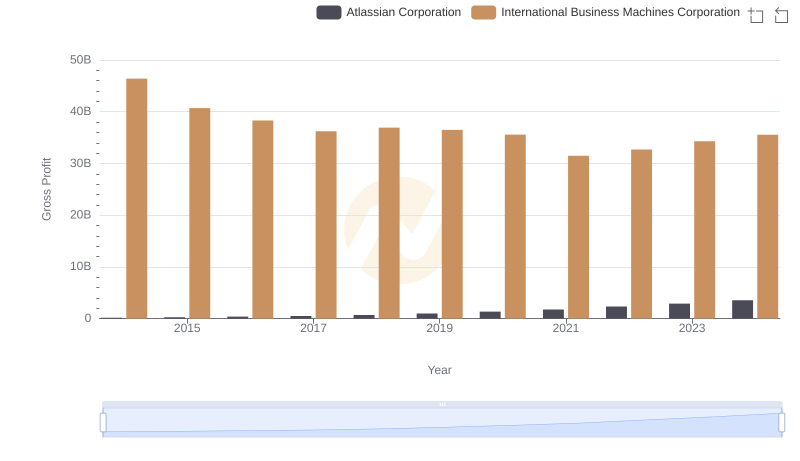
Gross Profit Comparison: International Business Machines Corporation and Atlassian Corporation Trends
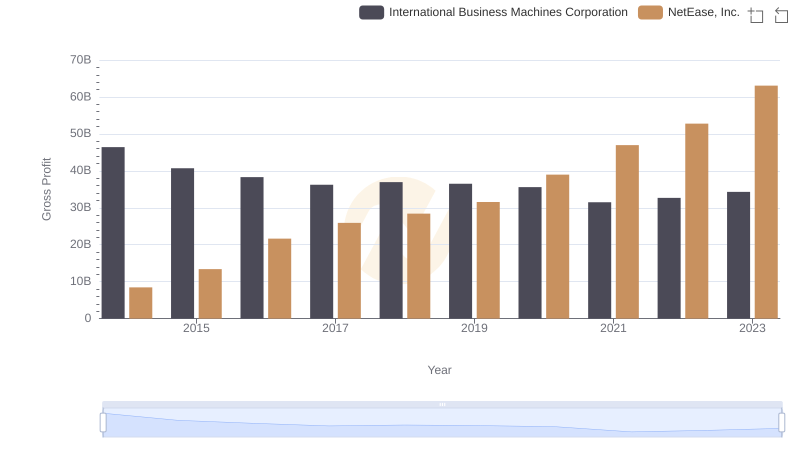
Gross Profit Analysis: Comparing International Business Machines Corporation and NetEase, Inc.
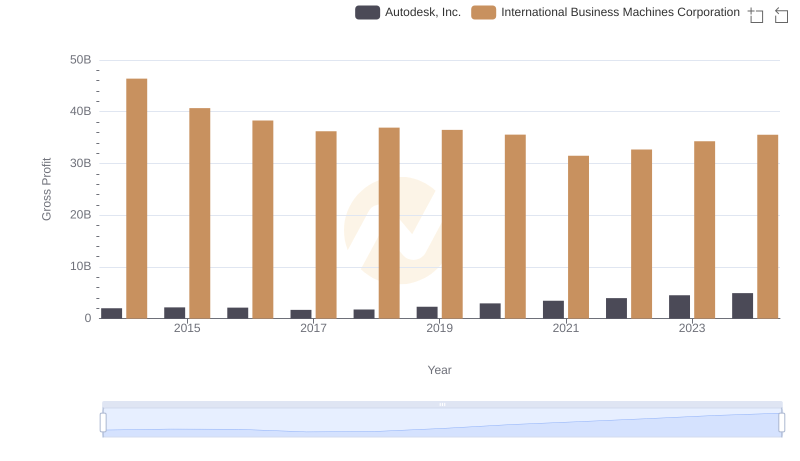
Key Insights on Gross Profit: International Business Machines Corporation vs Autodesk, Inc.
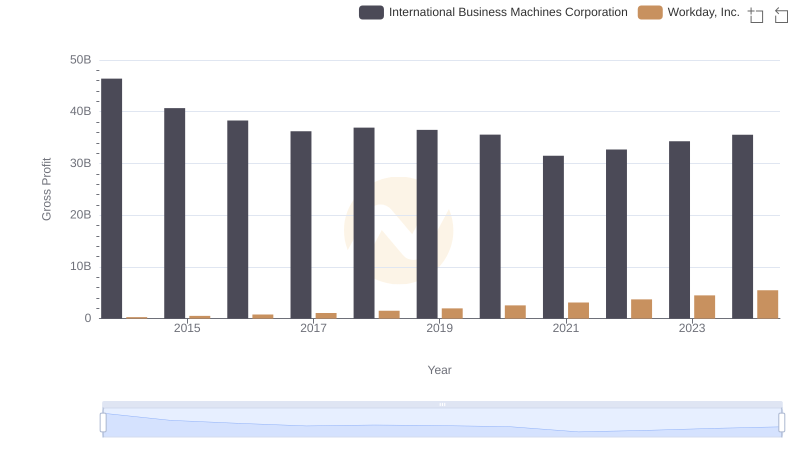
Key Insights on Gross Profit: International Business Machines Corporation vs Workday, Inc.
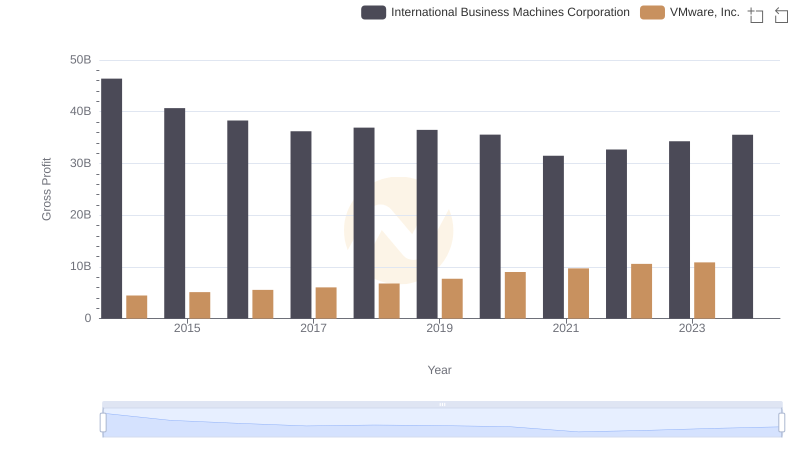
Gross Profit Analysis: Comparing International Business Machines Corporation and VMware, Inc.
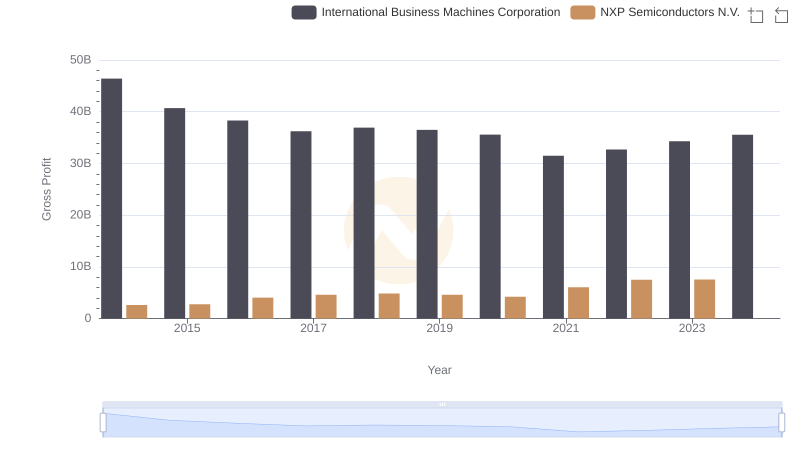
Gross Profit Comparison: International Business Machines Corporation and NXP Semiconductors N.V. Trends
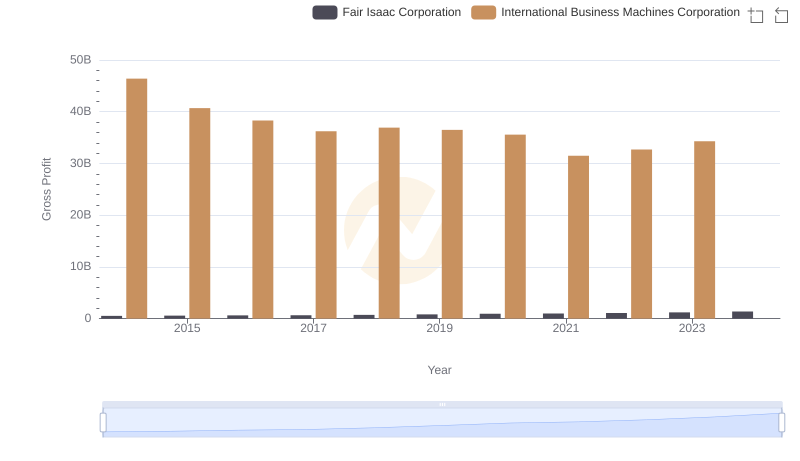
Who Generates Higher Gross Profit? International Business Machines Corporation or Fair Isaac Corporation

Comparing Innovation Spending: International Business Machines Corporation and The Trade Desk, Inc.
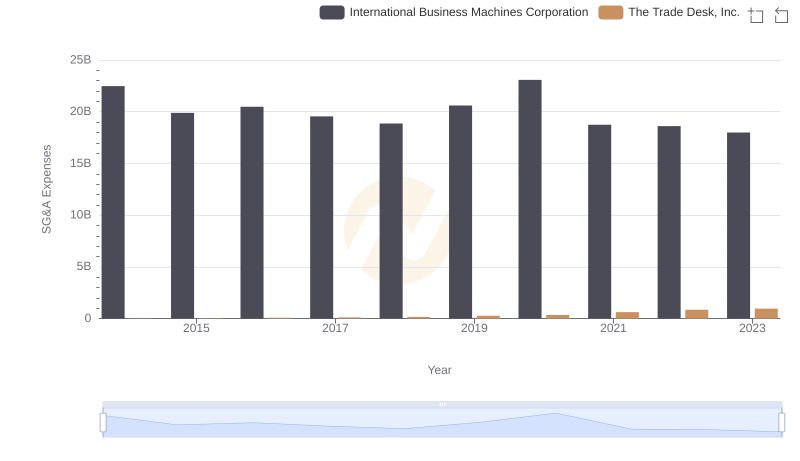
Operational Costs Compared: SG&A Analysis of International Business Machines Corporation and The Trade Desk, Inc.
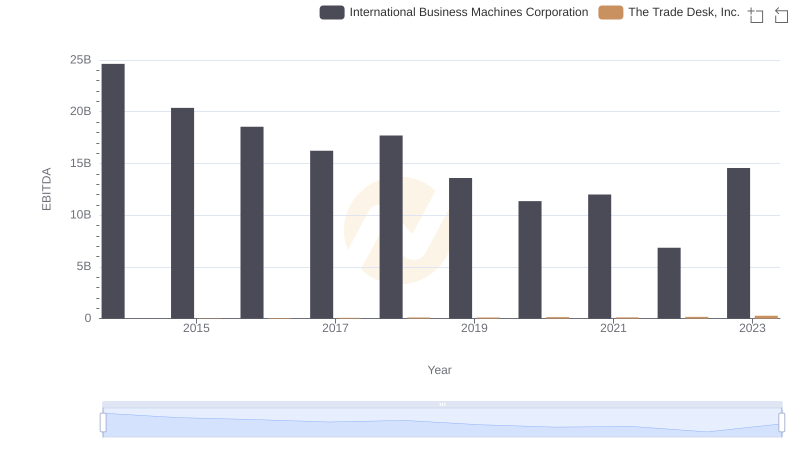
A Professional Review of EBITDA: International Business Machines Corporation Compared to The Trade Desk, Inc.