| __timestamp | International Business Machines Corporation | The Trade Desk, Inc. |
|---|---|---|
| Wednesday, January 1, 2014 | 22472000000 | 23975000 |
| Thursday, January 1, 2015 | 19894000000 | 40070000 |
| Friday, January 1, 2016 | 20279000000 | 78219000 |
| Sunday, January 1, 2017 | 19680000000 | 119825000 |
| Monday, January 1, 2018 | 19366000000 | 171981000 |
| Tuesday, January 1, 2019 | 18724000000 | 275930000 |
| Wednesday, January 1, 2020 | 20561000000 | 346359000 |
| Friday, January 1, 2021 | 18745000000 | 623959000 |
| Saturday, January 1, 2022 | 17483000000 | 863142000 |
| Sunday, January 1, 2023 | 17997000000 | 968248000 |
| Monday, January 1, 2024 | 29536000000 | 1082333000 |
Data in motion
In the ever-evolving landscape of corporate finance, understanding operational costs is crucial. This analysis delves into the Selling, General, and Administrative (SG&A) expenses of two industry titans: International Business Machines Corporation (IBM) and The Trade Desk, Inc. Over the past decade, IBM's SG&A expenses have consistently dwarfed those of The Trade Desk, reflecting its expansive global operations. In 2023, IBM's expenses were approximately 18 times higher than The Trade Desk's, highlighting the scale difference between the two companies. However, The Trade Desk has shown a remarkable growth trajectory, with its SG&A expenses increasing by over 3,900% from 2014 to 2023. This surge underscores The Trade Desk's rapid expansion in the digital advertising space. As we look to the future, the contrasting financial strategies of these companies offer valuable insights into their operational priorities and market positioning.
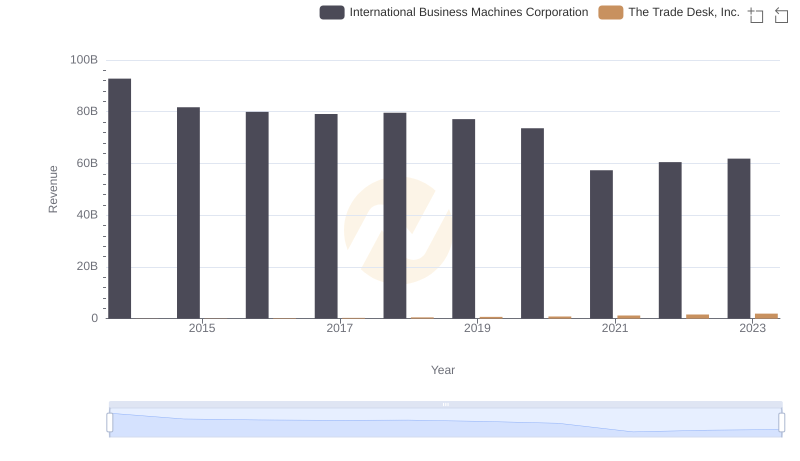
International Business Machines Corporation and The Trade Desk, Inc.: A Comprehensive Revenue Analysis
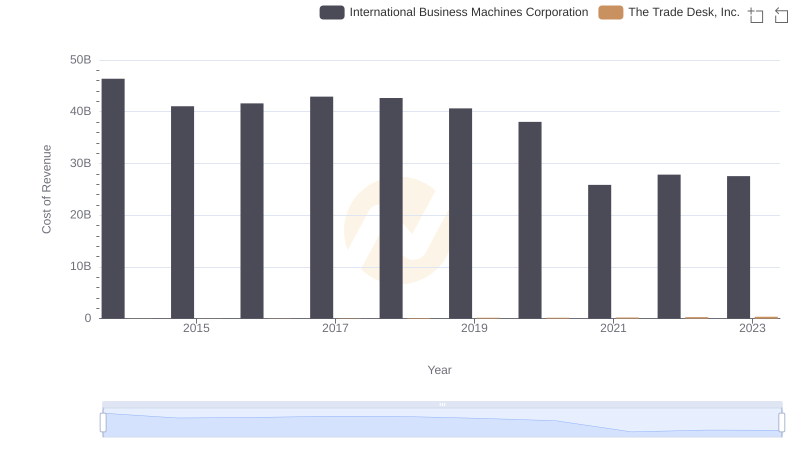
Cost Insights: Breaking Down International Business Machines Corporation and The Trade Desk, Inc.'s Expenses
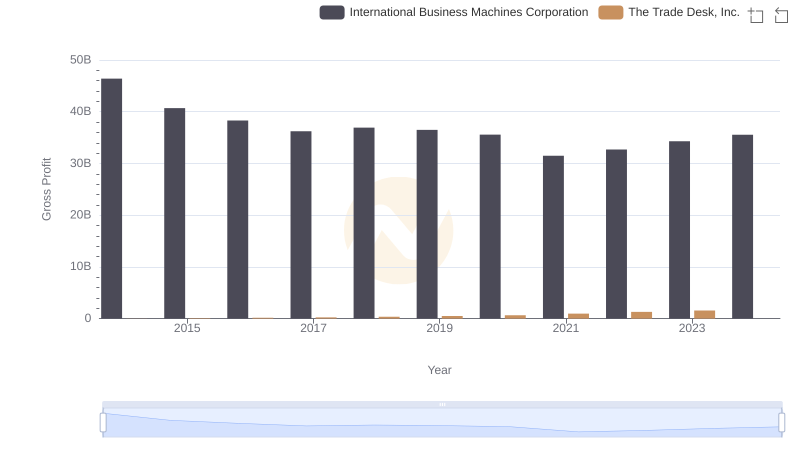
Key Insights on Gross Profit: International Business Machines Corporation vs The Trade Desk, Inc.
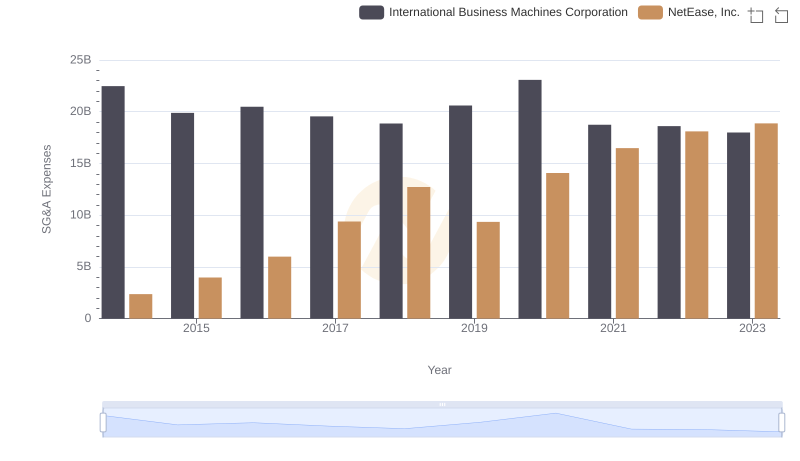
Cost Management Insights: SG&A Expenses for International Business Machines Corporation and NetEase, Inc.

Comparing Innovation Spending: International Business Machines Corporation and The Trade Desk, Inc.
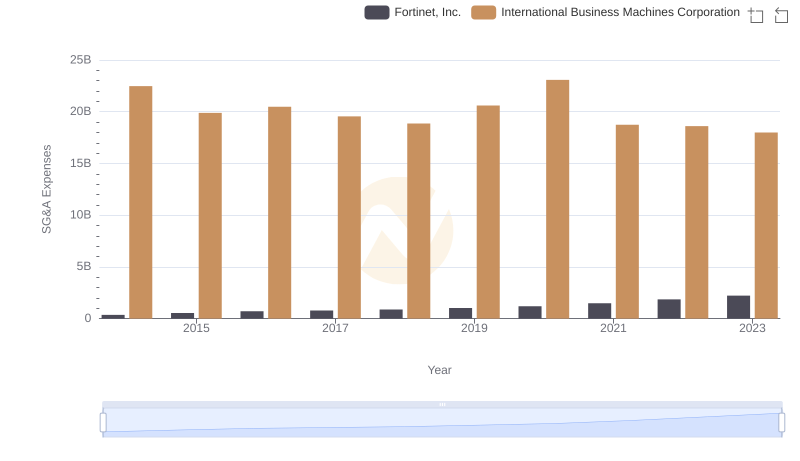
Cost Management Insights: SG&A Expenses for International Business Machines Corporation and Fortinet, Inc.
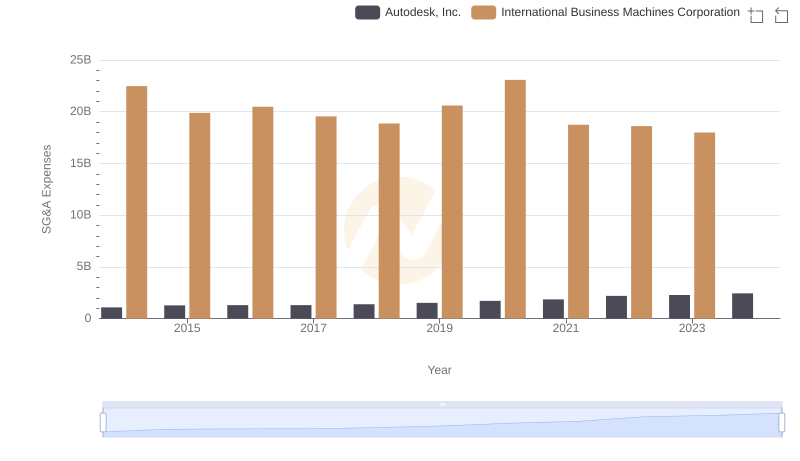
International Business Machines Corporation vs Autodesk, Inc.: SG&A Expense Trends
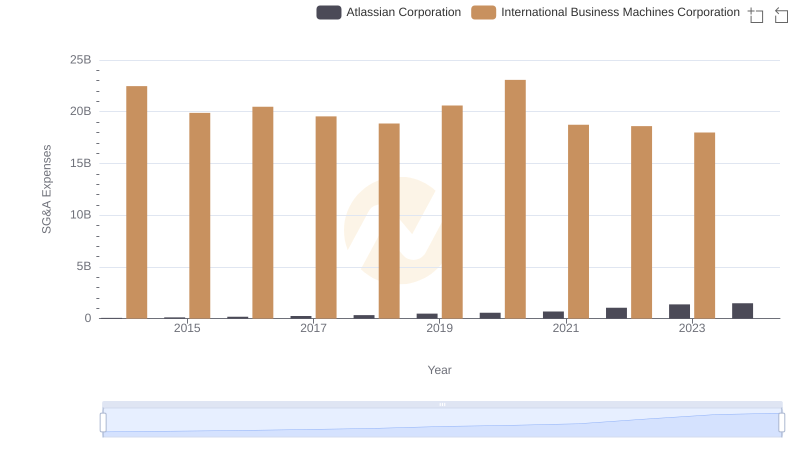
Operational Costs Compared: SG&A Analysis of International Business Machines Corporation and Atlassian Corporation
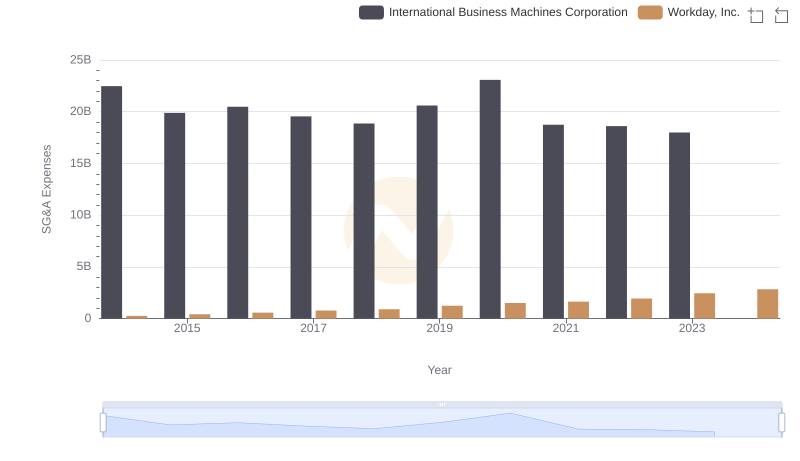
Who Optimizes SG&A Costs Better? International Business Machines Corporation or Workday, Inc.
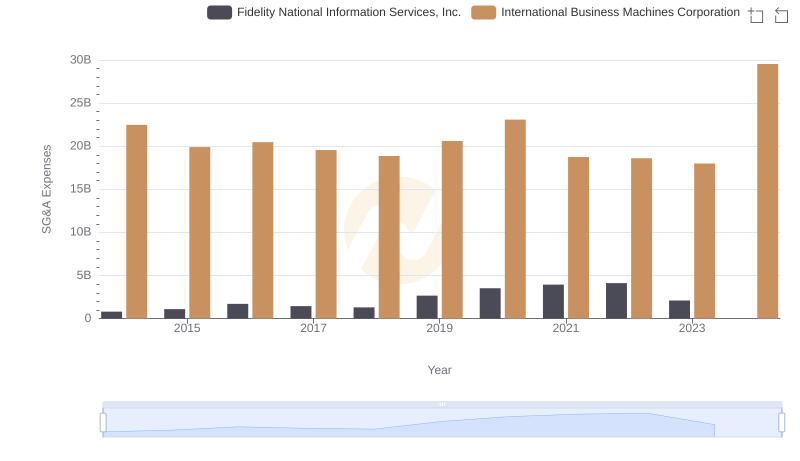
Comparing SG&A Expenses: International Business Machines Corporation vs Fidelity National Information Services, Inc. Trends and Insights
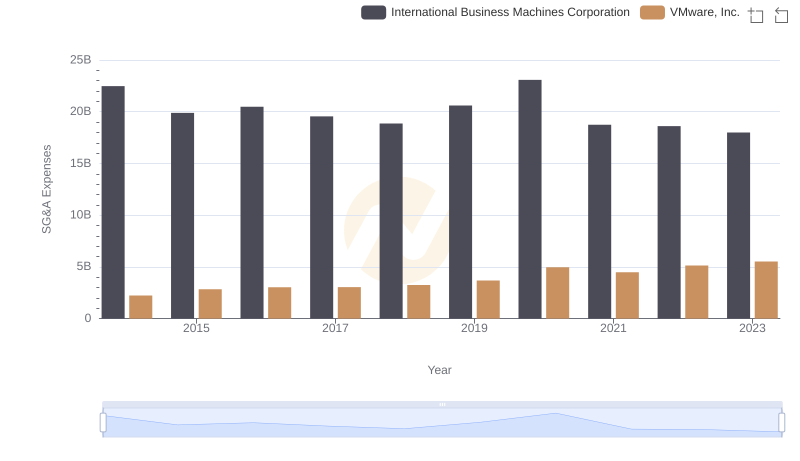
Breaking Down SG&A Expenses: International Business Machines Corporation vs VMware, Inc.
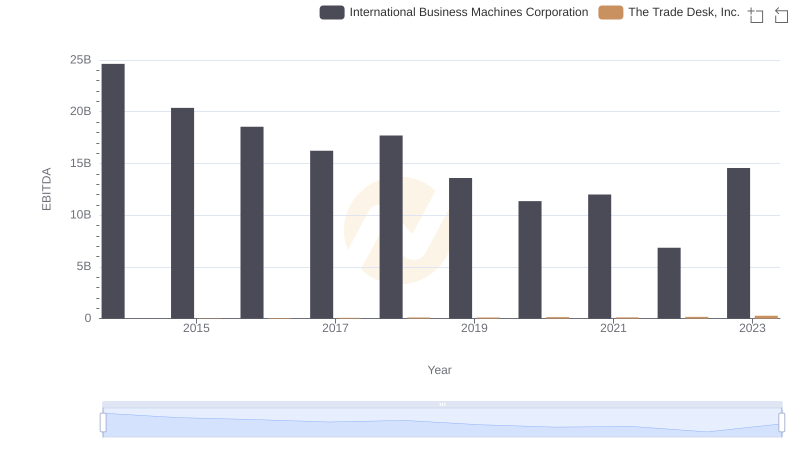
A Professional Review of EBITDA: International Business Machines Corporation Compared to The Trade Desk, Inc.