| __timestamp | Atlassian Corporation | International Business Machines Corporation |
|---|---|---|
| Wednesday, January 1, 2014 | 177123000 | 46407000000 |
| Thursday, January 1, 2015 | 266589000 | 40684000000 |
| Friday, January 1, 2016 | 381275000 | 38516000000 |
| Sunday, January 1, 2017 | 500775000 | 36943000000 |
| Monday, January 1, 2018 | 701260000 | 36936000000 |
| Tuesday, January 1, 2019 | 999842000 | 31533000000 |
| Wednesday, January 1, 2020 | 1345366000 | 30865000000 |
| Friday, January 1, 2021 | 1753111000 | 31486000000 |
| Saturday, January 1, 2022 | 2337175000 | 32687000000 |
| Sunday, January 1, 2023 | 2900882000 | 34300000000 |
| Monday, January 1, 2024 | 3555108000 | 35551000000 |
Unleashing the power of data
In the ever-evolving landscape of technology, the financial trajectories of International Business Machines Corporation (IBM) and Atlassian Corporation offer a fascinating study. Over the past decade, IBM, a stalwart in the tech industry, has consistently maintained a robust gross profit, peaking at approximately $46 billion in 2014. However, a gradual decline has been observed, with a 26% decrease by 2024.
Conversely, Atlassian, a relatively newer player, has shown remarkable growth. From a modest $177 million in 2014, its gross profit surged by an impressive 1,900% to reach $3.6 billion in 2024. This stark contrast highlights the dynamic shifts within the tech sector, where innovation and adaptability are key.
As we look to the future, the question remains: will Atlassian continue its upward trajectory, and can IBM reinvent itself to regain its former glory?
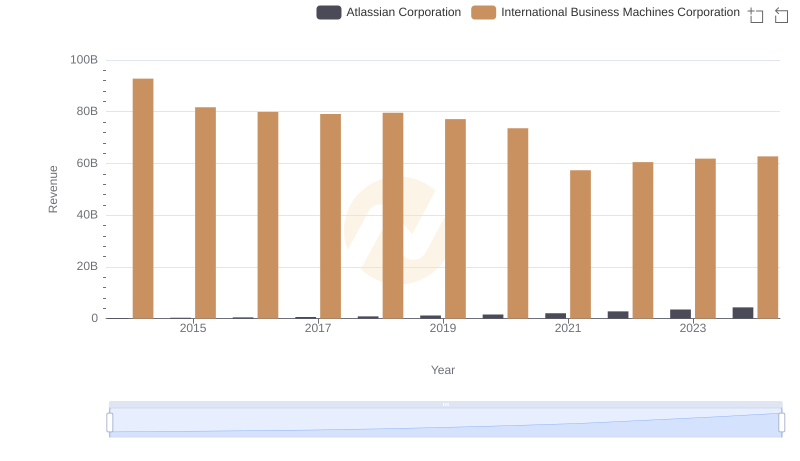
International Business Machines Corporation and Atlassian Corporation: A Comprehensive Revenue Analysis
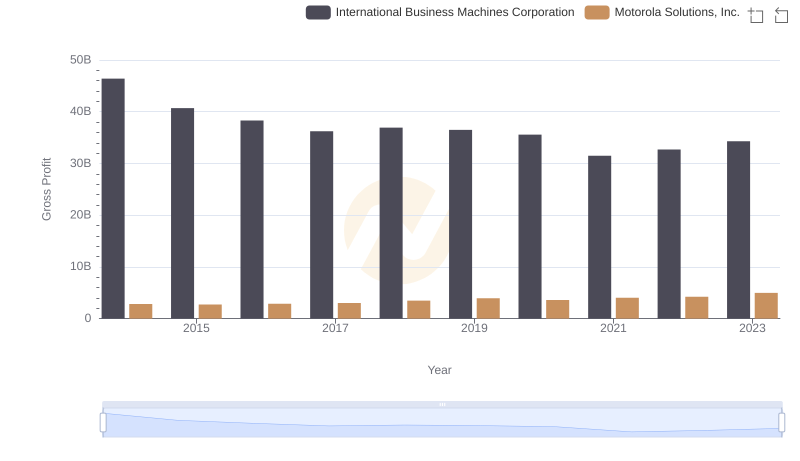
Gross Profit Trends Compared: International Business Machines Corporation vs Motorola Solutions, Inc.
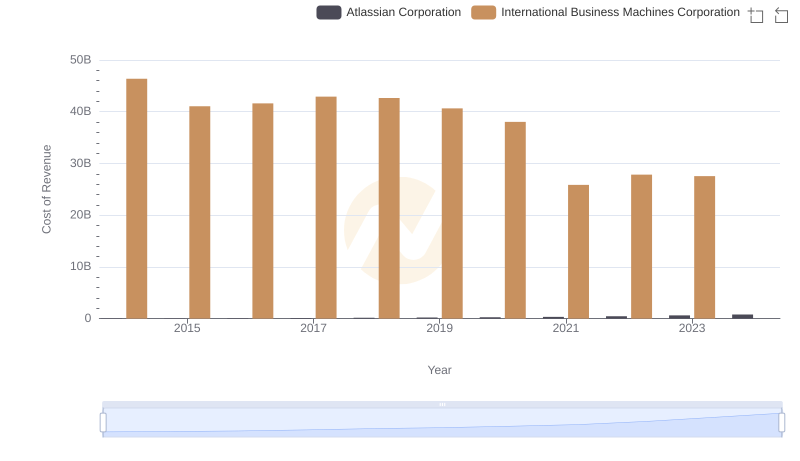
Cost of Revenue: Key Insights for International Business Machines Corporation and Atlassian Corporation
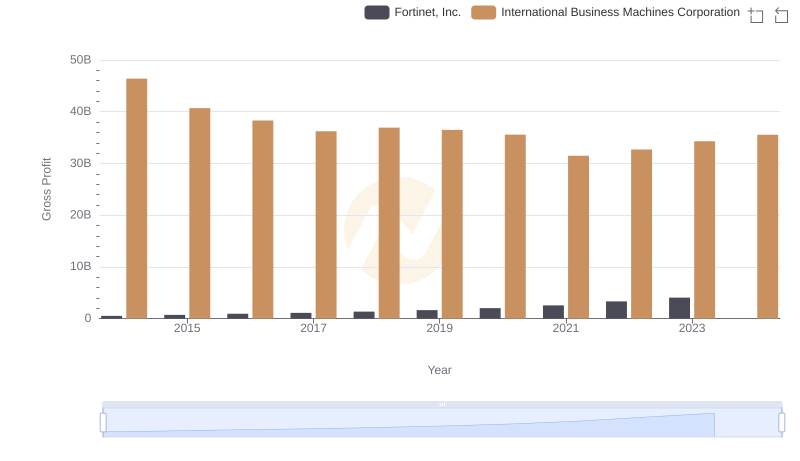
Who Generates Higher Gross Profit? International Business Machines Corporation or Fortinet, Inc.
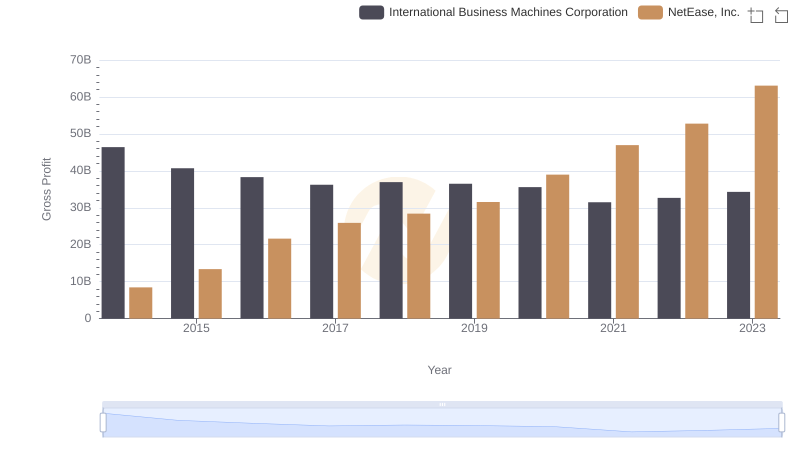
Gross Profit Analysis: Comparing International Business Machines Corporation and NetEase, Inc.
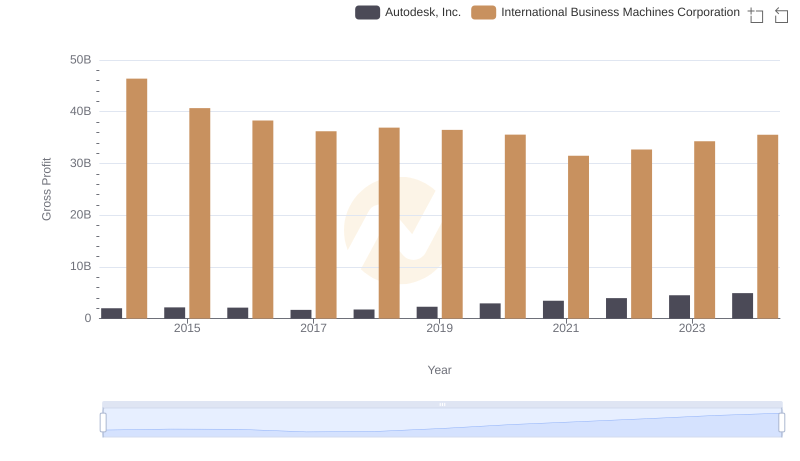
Key Insights on Gross Profit: International Business Machines Corporation vs Autodesk, Inc.
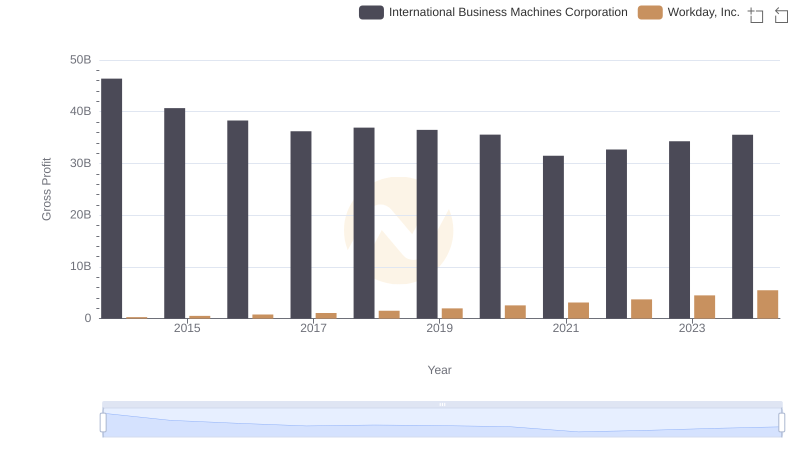
Key Insights on Gross Profit: International Business Machines Corporation vs Workday, Inc.
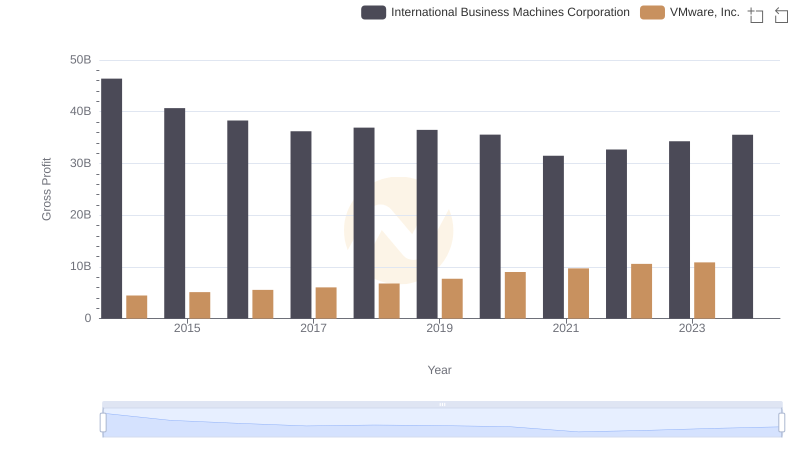
Gross Profit Analysis: Comparing International Business Machines Corporation and VMware, Inc.
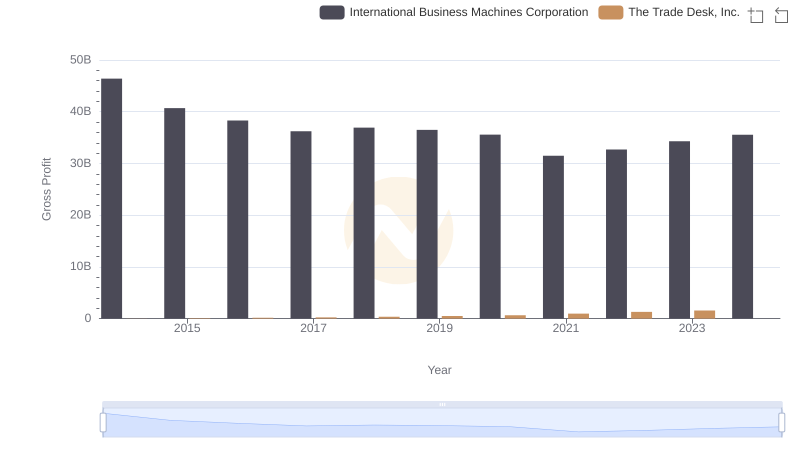
Key Insights on Gross Profit: International Business Machines Corporation vs The Trade Desk, Inc.
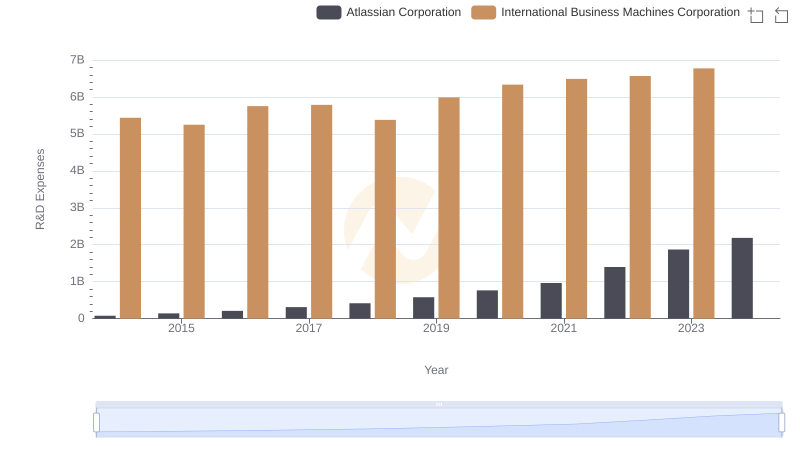
International Business Machines Corporation or Atlassian Corporation: Who Invests More in Innovation?
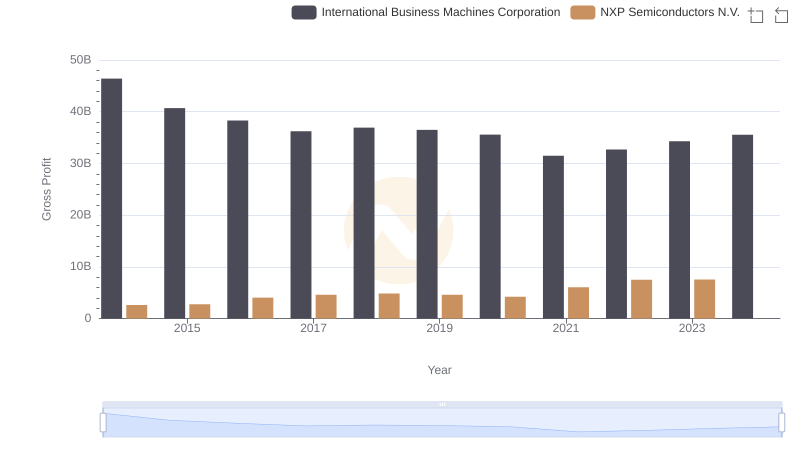
Gross Profit Comparison: International Business Machines Corporation and NXP Semiconductors N.V. Trends
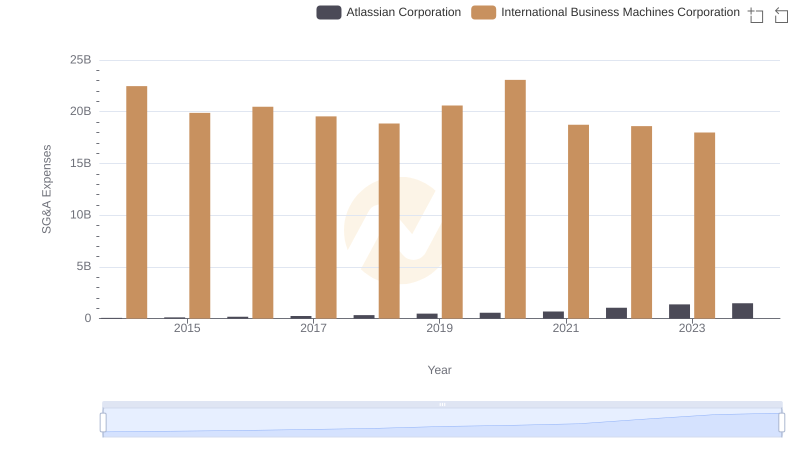
Operational Costs Compared: SG&A Analysis of International Business Machines Corporation and Atlassian Corporation