| __timestamp | International Business Machines Corporation | NetEase, Inc. |
|---|---|---|
| Wednesday, January 1, 2014 | 46407000000 | 8451290000 |
| Thursday, January 1, 2015 | 40684000000 | 13403635000 |
| Friday, January 1, 2016 | 38516000000 | 21663812000 |
| Sunday, January 1, 2017 | 36943000000 | 25912693000 |
| Monday, January 1, 2018 | 36936000000 | 28403496000 |
| Tuesday, January 1, 2019 | 31533000000 | 31555300000 |
| Wednesday, January 1, 2020 | 30865000000 | 38983402000 |
| Friday, January 1, 2021 | 31486000000 | 46970801000 |
| Saturday, January 1, 2022 | 32687000000 | 52766126000 |
| Sunday, January 1, 2023 | 34300000000 | 63063394000 |
| Monday, January 1, 2024 | 35551000000 |
Unleashing the power of data
In the ever-evolving landscape of global technology, the financial performance of industry giants like International Business Machines Corporation (IBM) and NetEase, Inc. offers a fascinating glimpse into their strategic maneuvers. Over the past decade, IBM's gross profit has seen a decline of approximately 24%, from its peak in 2014 to 2023. This trend reflects the company's ongoing transformation and adaptation to new market demands.
Conversely, NetEase has experienced a remarkable surge, with its gross profit increasing by nearly 646% over the same period. This growth underscores NetEase's successful expansion and innovation in the digital entertainment sector. Notably, in 2023, NetEase's gross profit surpassed IBM's, marking a significant milestone in its financial journey.
While IBM's data for 2024 remains incomplete, the contrasting trajectories of these two companies highlight the dynamic nature of the tech industry and the diverse strategies employed by its leaders.
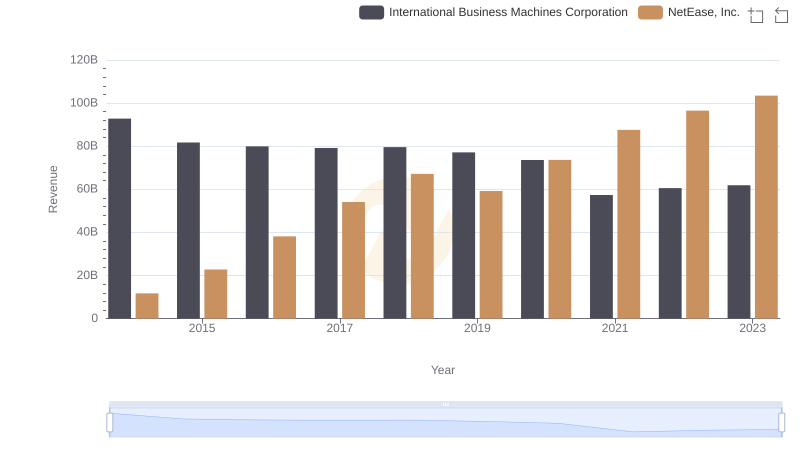
Comparing Revenue Performance: International Business Machines Corporation or NetEase, Inc.?
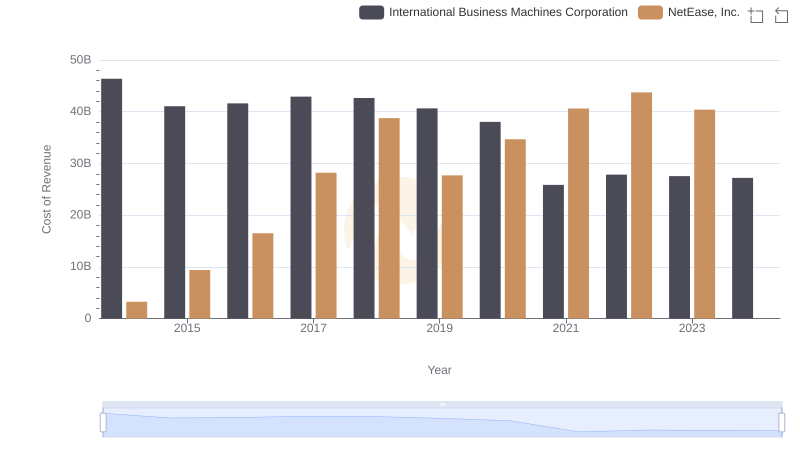
Cost of Revenue: Key Insights for International Business Machines Corporation and NetEase, Inc.
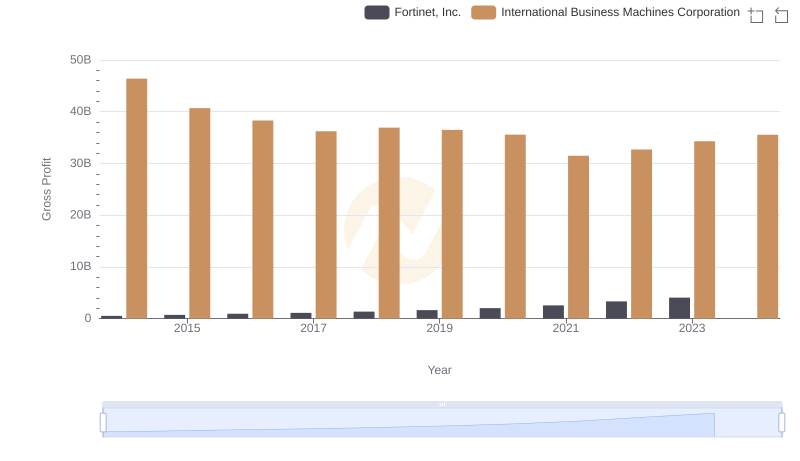
Who Generates Higher Gross Profit? International Business Machines Corporation or Fortinet, Inc.
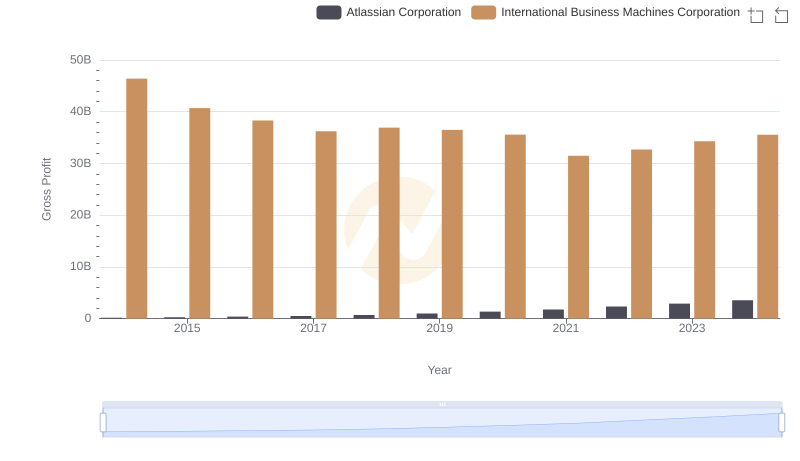
Gross Profit Comparison: International Business Machines Corporation and Atlassian Corporation Trends
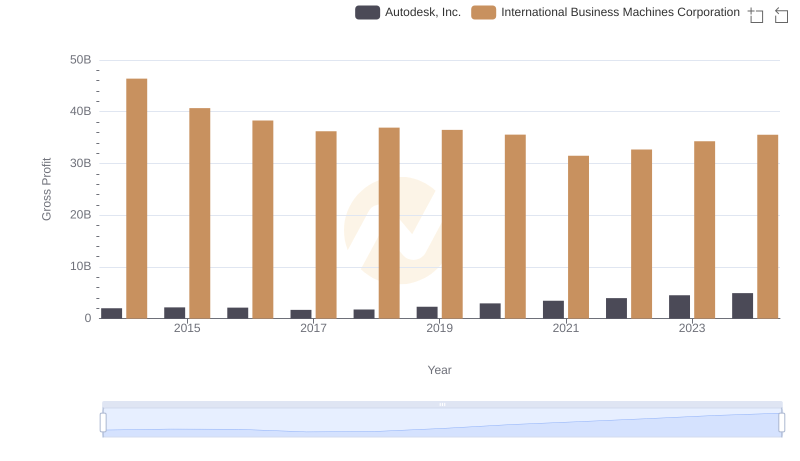
Key Insights on Gross Profit: International Business Machines Corporation vs Autodesk, Inc.
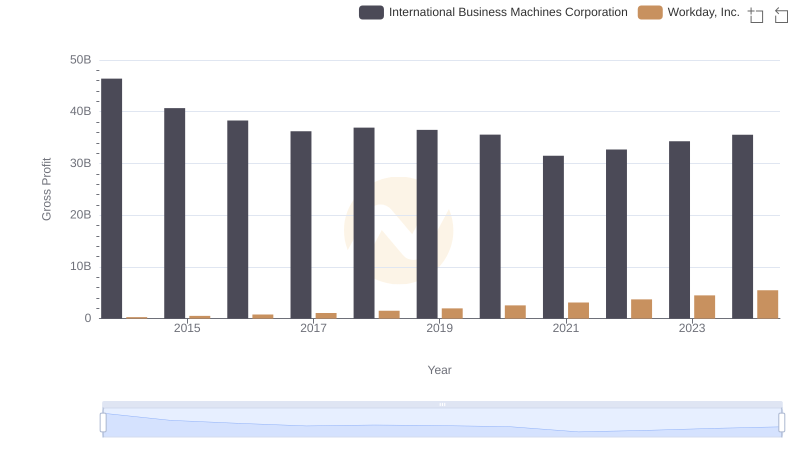
Key Insights on Gross Profit: International Business Machines Corporation vs Workday, Inc.
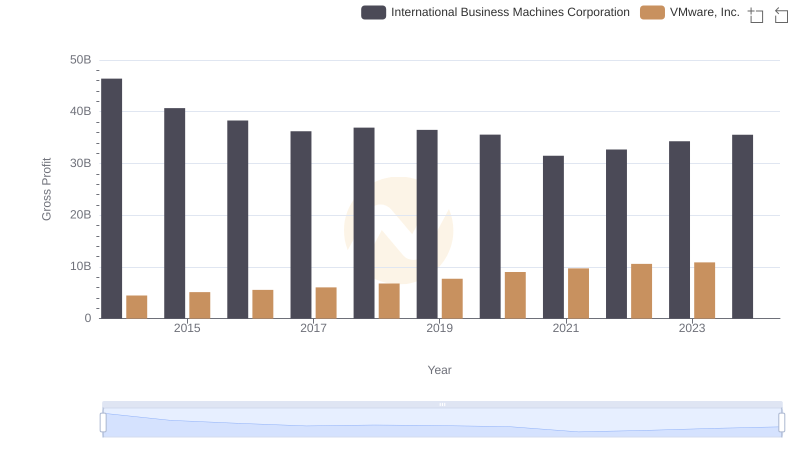
Gross Profit Analysis: Comparing International Business Machines Corporation and VMware, Inc.
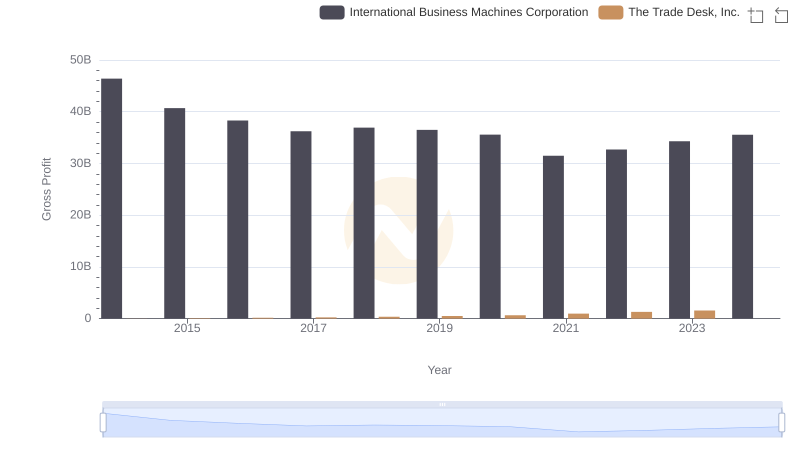
Key Insights on Gross Profit: International Business Machines Corporation vs The Trade Desk, Inc.
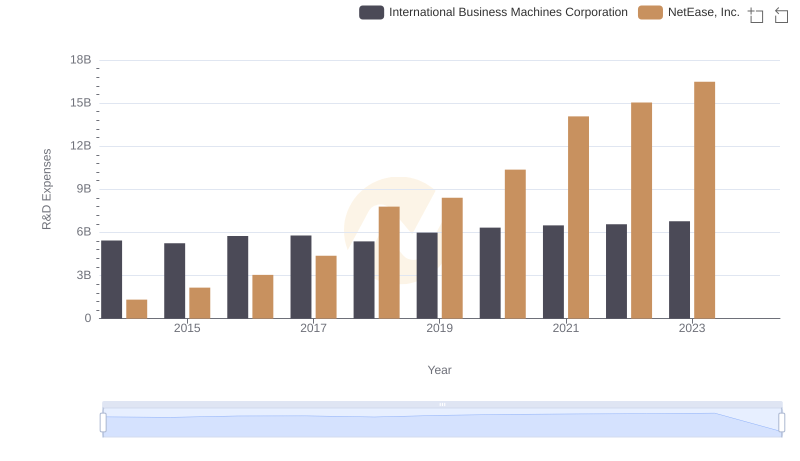
Who Prioritizes Innovation? R&D Spending Compared for International Business Machines Corporation and NetEase, Inc.
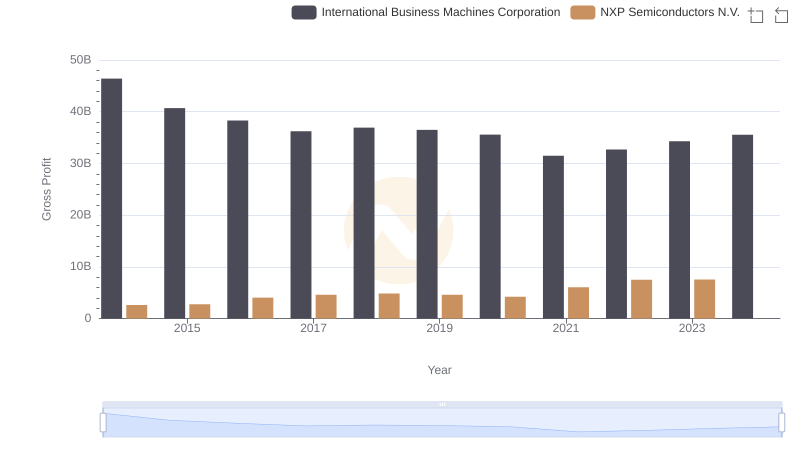
Gross Profit Comparison: International Business Machines Corporation and NXP Semiconductors N.V. Trends
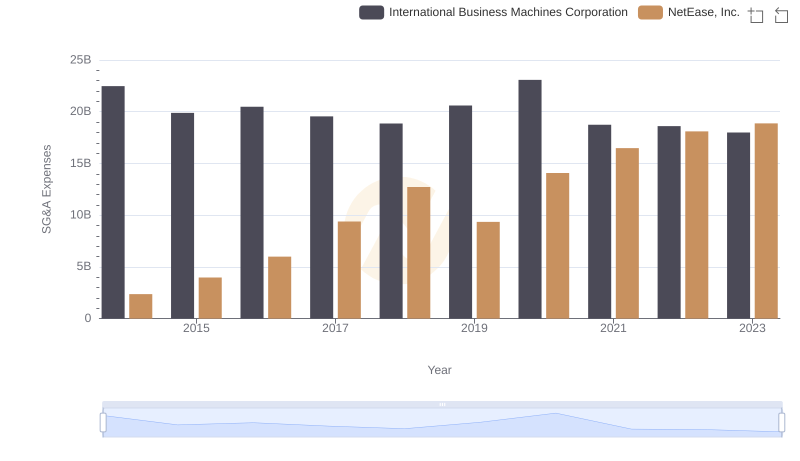
Cost Management Insights: SG&A Expenses for International Business Machines Corporation and NetEase, Inc.
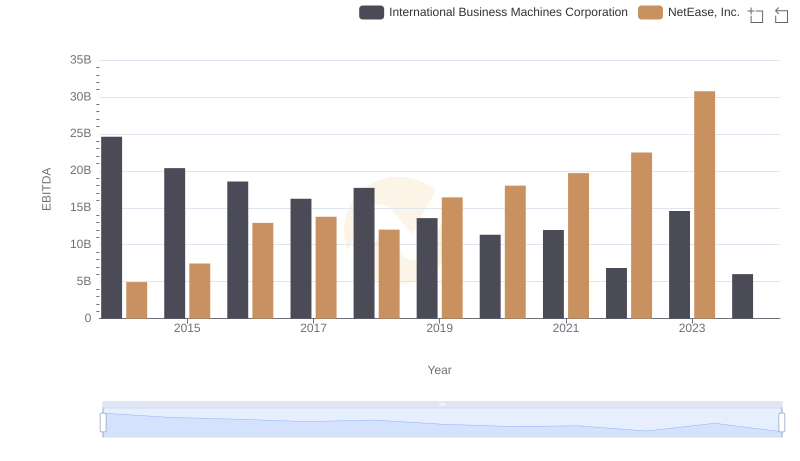
A Professional Review of EBITDA: International Business Machines Corporation Compared to NetEase, Inc.