| __timestamp | International Business Machines Corporation | VMware, Inc. |
|---|---|---|
| Wednesday, January 1, 2014 | 46407000000 | 4477000000 |
| Thursday, January 1, 2015 | 40684000000 | 5118000000 |
| Friday, January 1, 2016 | 38516000000 | 5553000000 |
| Sunday, January 1, 2017 | 36943000000 | 6040000000 |
| Monday, January 1, 2018 | 36936000000 | 6781000000 |
| Tuesday, January 1, 2019 | 31533000000 | 7716000000 |
| Wednesday, January 1, 2020 | 30865000000 | 9012000000 |
| Friday, January 1, 2021 | 31486000000 | 9724000000 |
| Saturday, January 1, 2022 | 32687000000 | 10580000000 |
| Sunday, January 1, 2023 | 34300000000 | 10868000000 |
| Monday, January 1, 2024 | 35551000000 |
Unleashing insights
In the ever-evolving landscape of technology, the financial performance of industry giants like International Business Machines Corporation (IBM) and VMware, Inc. offers a fascinating glimpse into their strategic maneuvers. Over the past decade, IBM's gross profit has seen a decline of approximately 24%, from its peak in 2014 to 2023. This trend reflects the company's ongoing transformation and adaptation to new market demands. Meanwhile, VMware has demonstrated a robust growth trajectory, with its gross profit more than doubling over the same period, highlighting its strong position in the virtualization and cloud computing sectors.
The data reveals a compelling narrative of two companies navigating the complexities of the tech industry. While IBM's gross profit dipped to its lowest in 2021, VMware's figures surged, underscoring its resilience and strategic foresight. Notably, the data for 2024 is incomplete, leaving room for speculation on future trends.
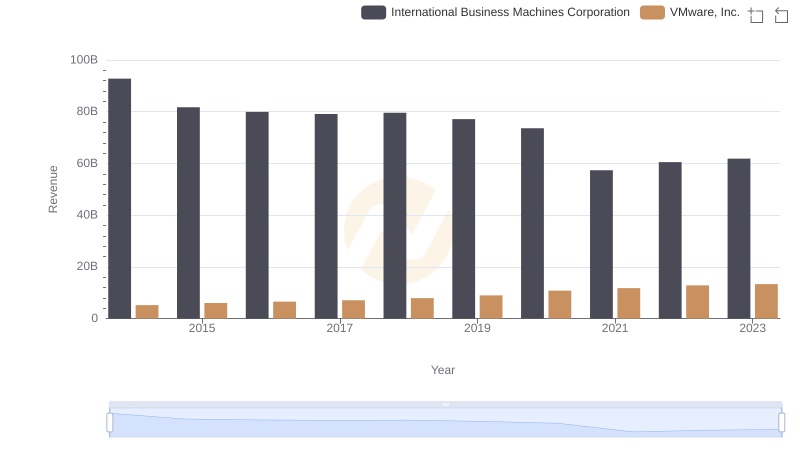
Revenue Insights: International Business Machines Corporation and VMware, Inc. Performance Compared
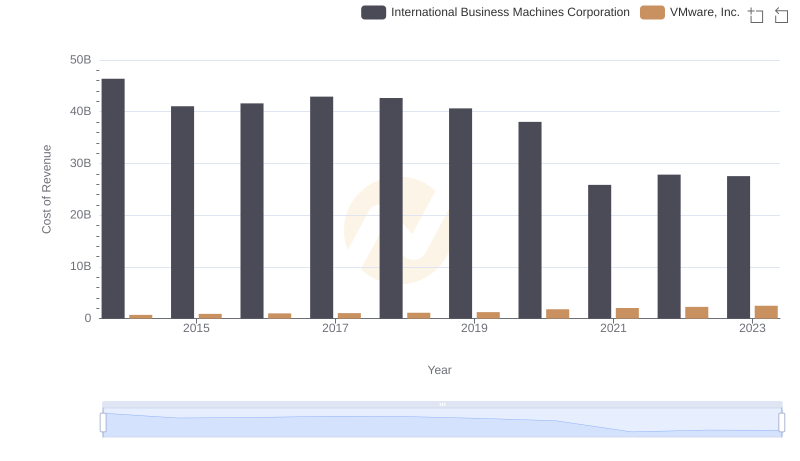
Cost of Revenue Trends: International Business Machines Corporation vs VMware, Inc.
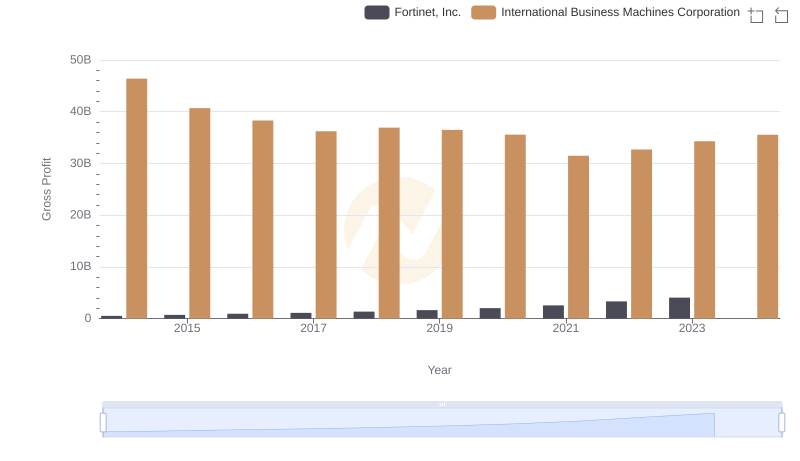
Who Generates Higher Gross Profit? International Business Machines Corporation or Fortinet, Inc.
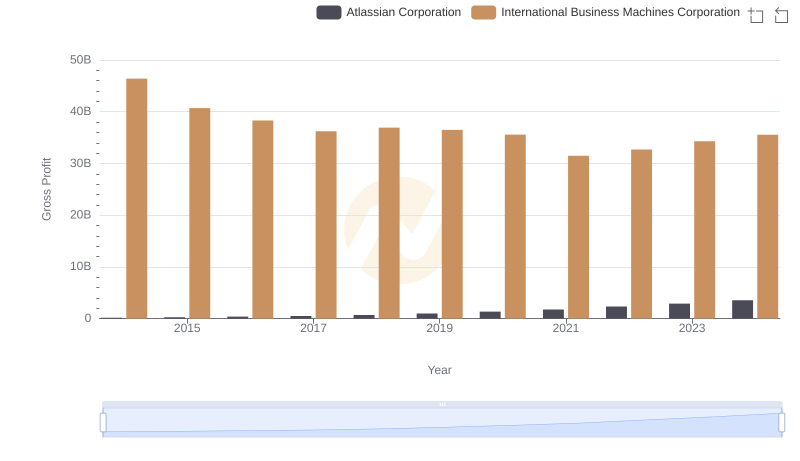
Gross Profit Comparison: International Business Machines Corporation and Atlassian Corporation Trends
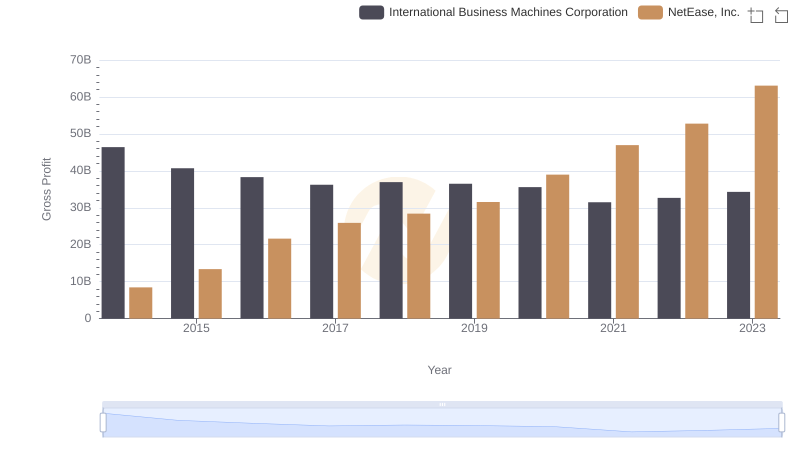
Gross Profit Analysis: Comparing International Business Machines Corporation and NetEase, Inc.
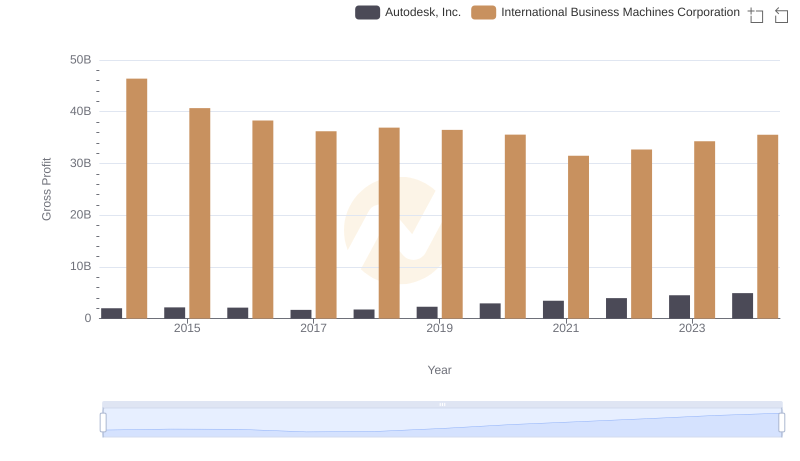
Key Insights on Gross Profit: International Business Machines Corporation vs Autodesk, Inc.
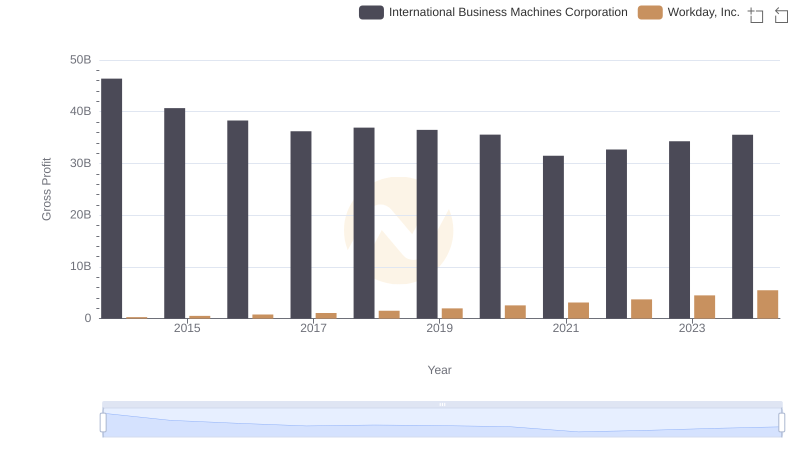
Key Insights on Gross Profit: International Business Machines Corporation vs Workday, Inc.
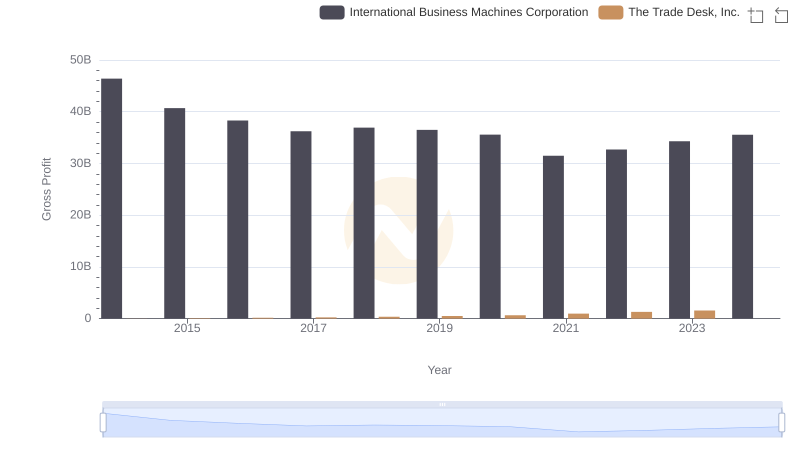
Key Insights on Gross Profit: International Business Machines Corporation vs The Trade Desk, Inc.
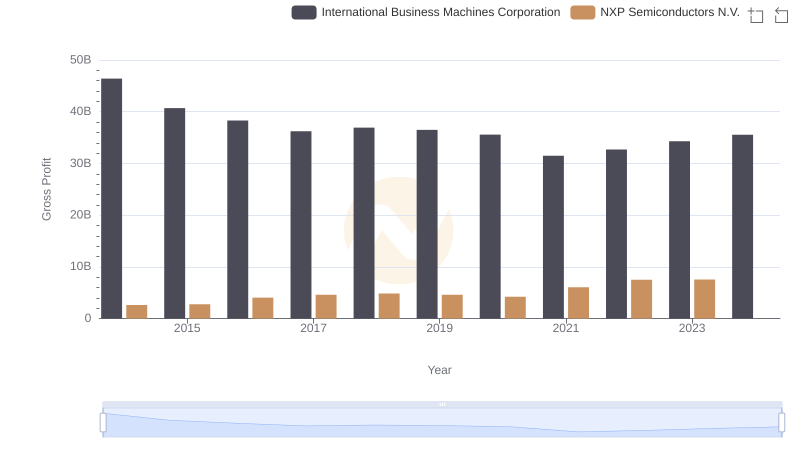
Gross Profit Comparison: International Business Machines Corporation and NXP Semiconductors N.V. Trends
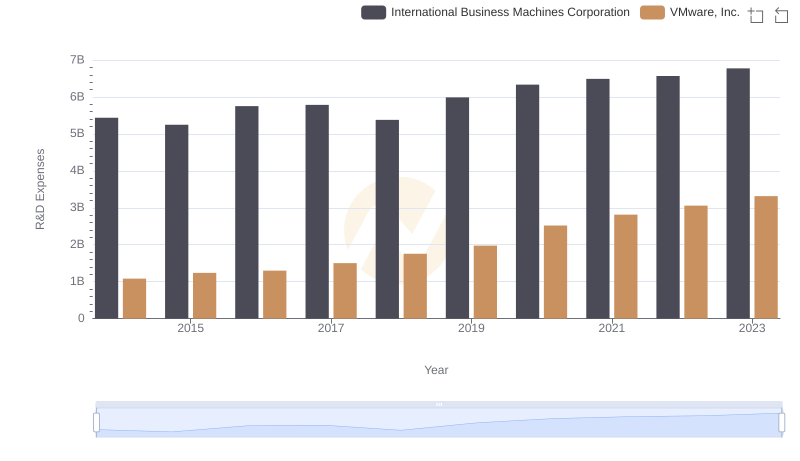
Research and Development: Comparing Key Metrics for International Business Machines Corporation and VMware, Inc.
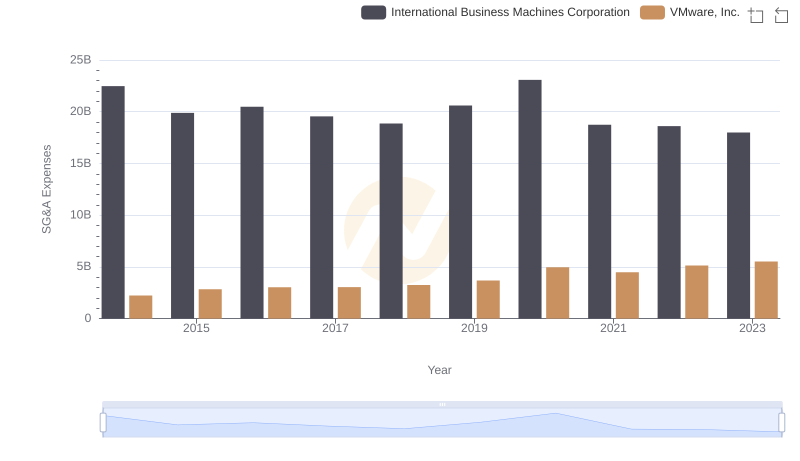
Breaking Down SG&A Expenses: International Business Machines Corporation vs VMware, Inc.

International Business Machines Corporation and VMware, Inc.: A Detailed Examination of EBITDA Performance