| __timestamp | International Business Machines Corporation | The Trade Desk, Inc. |
|---|---|---|
| Wednesday, January 1, 2014 | 92793000000 | 44548000 |
| Thursday, January 1, 2015 | 81742000000 | 113836000 |
| Friday, January 1, 2016 | 79920000000 | 202926000 |
| Sunday, January 1, 2017 | 79139000000 | 308217000 |
| Monday, January 1, 2018 | 79591000000 | 477294000 |
| Tuesday, January 1, 2019 | 57714000000 | 661058000 |
| Wednesday, January 1, 2020 | 55179000000 | 836033000 |
| Friday, January 1, 2021 | 57351000000 | 1196467000 |
| Saturday, January 1, 2022 | 60530000000 | 1577795000 |
| Sunday, January 1, 2023 | 61860000000 | 1946120000 |
| Monday, January 1, 2024 | 62753000000 | 2444831000 |
Unleashing insights
In the ever-evolving landscape of technology and advertising, International Business Machines Corporation (IBM) and The Trade Desk, Inc. stand as titans in their respective fields. Over the past decade, IBM's revenue has seen a gradual decline, dropping from its peak in 2014 to a more modest figure in 2023. This represents a decrease of approximately 33%, reflecting the challenges faced by traditional tech giants in adapting to new market dynamics.
Conversely, The Trade Desk, a leader in digital advertising, has experienced exponential growth. From 2014 to 2023, its revenue surged by over 4,000%, showcasing the rapid expansion and increasing importance of digital advertising platforms. This stark contrast highlights the shifting tides in the tech industry, where agility and innovation are key to thriving in a digital-first world.
As we look to the future, the data suggests that adaptability and foresight will be crucial for sustained success.
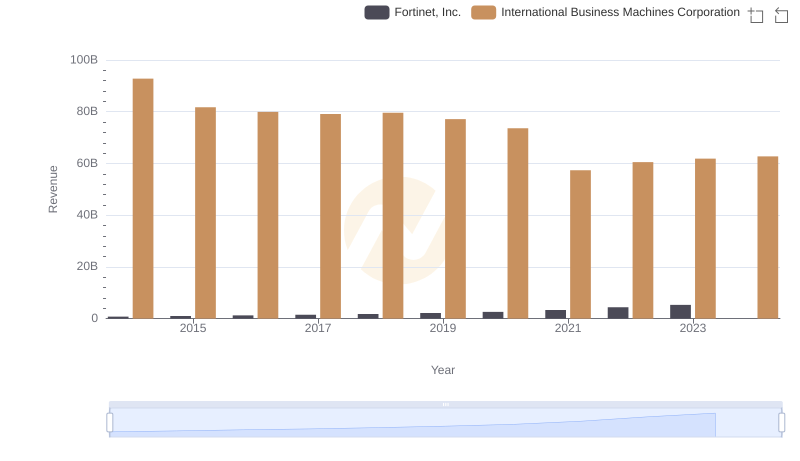
Revenue Insights: International Business Machines Corporation and Fortinet, Inc. Performance Compared
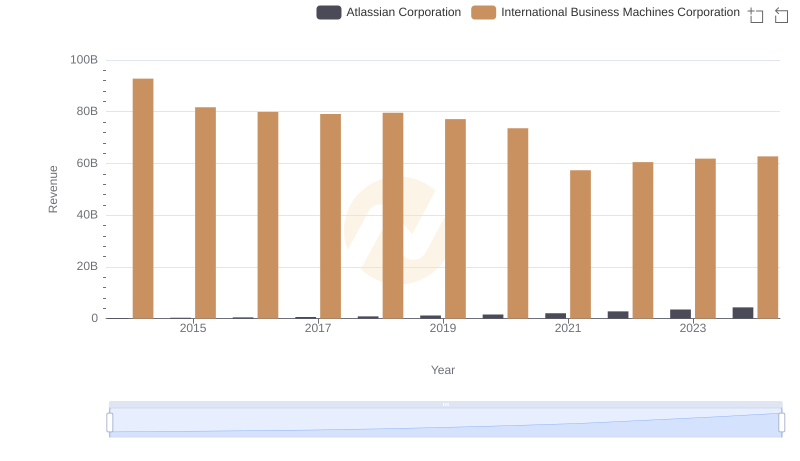
International Business Machines Corporation and Atlassian Corporation: A Comprehensive Revenue Analysis
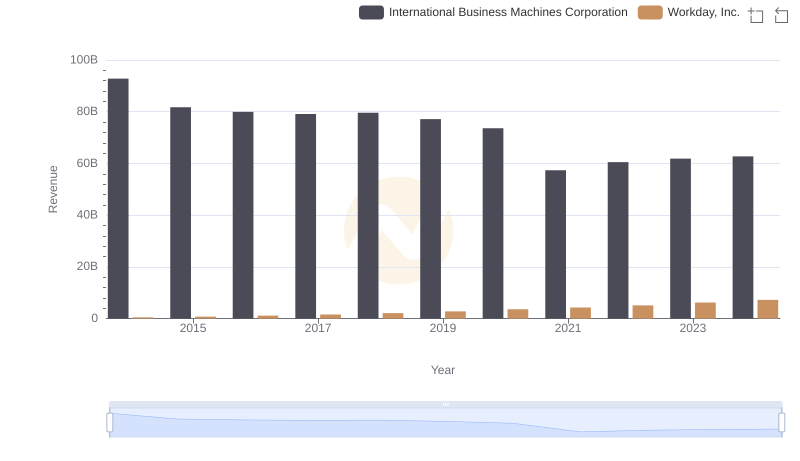
Revenue Insights: International Business Machines Corporation and Workday, Inc. Performance Compared
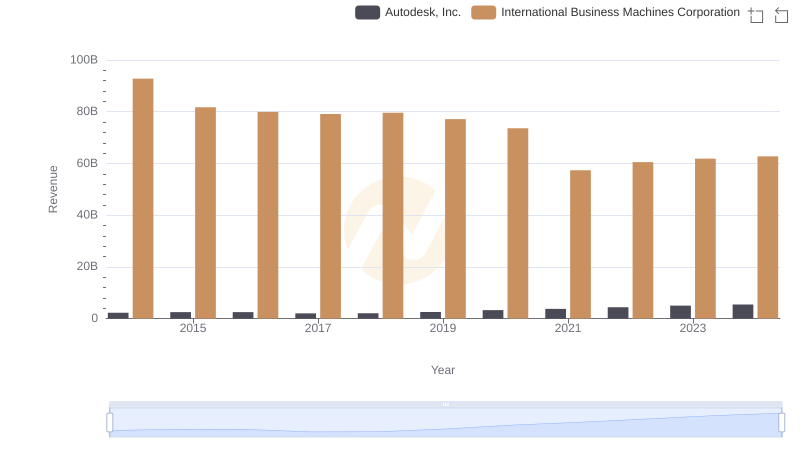
Breaking Down Revenue Trends: International Business Machines Corporation vs Autodesk, Inc.
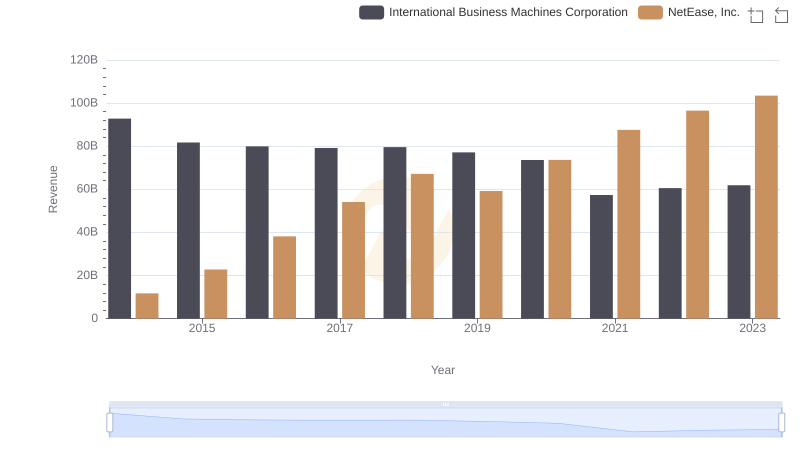
Comparing Revenue Performance: International Business Machines Corporation or NetEase, Inc.?
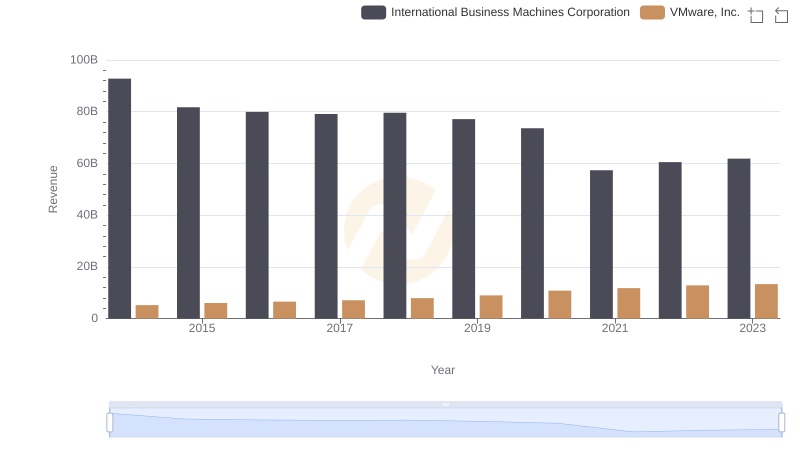
Revenue Insights: International Business Machines Corporation and VMware, Inc. Performance Compared
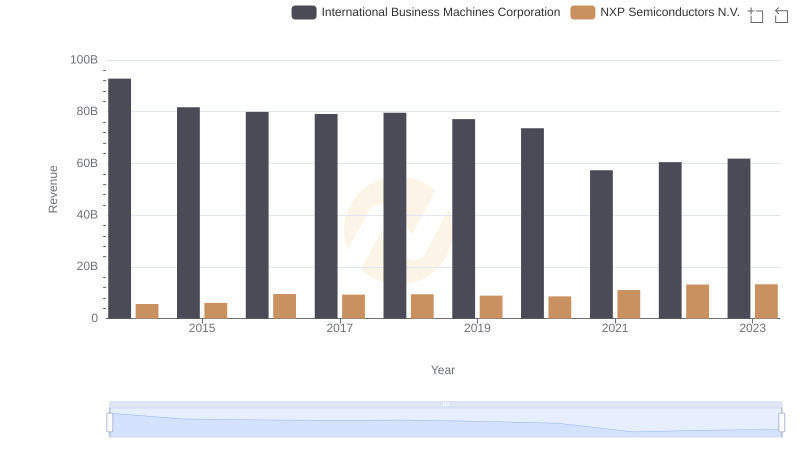
Comparing Revenue Performance: International Business Machines Corporation or NXP Semiconductors N.V.?
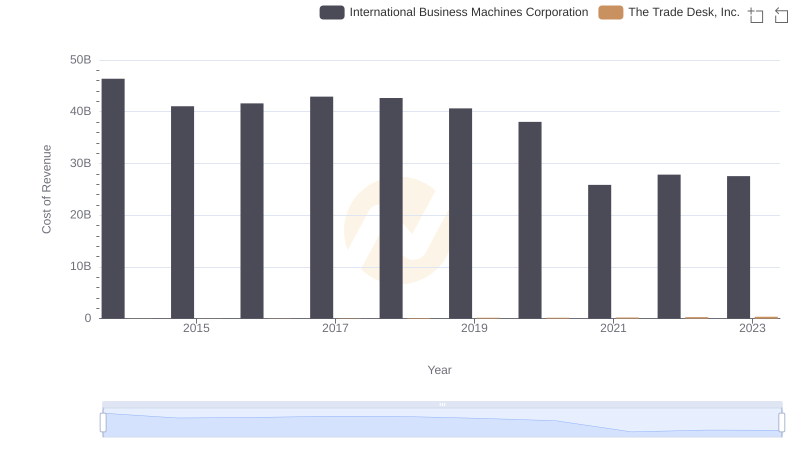
Cost Insights: Breaking Down International Business Machines Corporation and The Trade Desk, Inc.'s Expenses
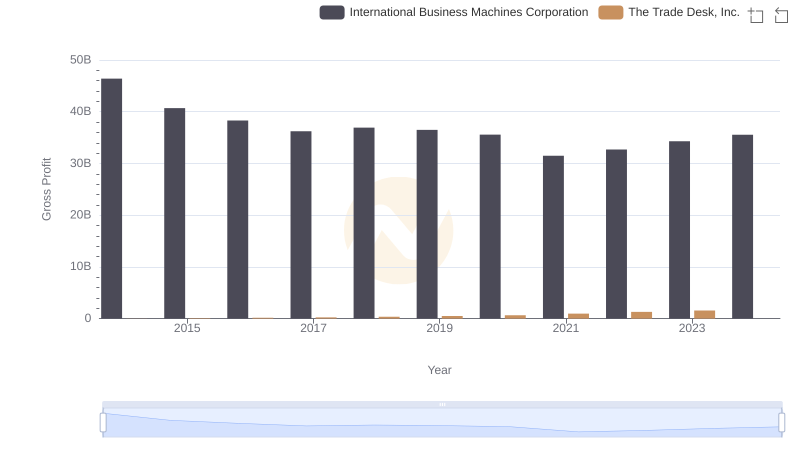
Key Insights on Gross Profit: International Business Machines Corporation vs The Trade Desk, Inc.

Comparing Innovation Spending: International Business Machines Corporation and The Trade Desk, Inc.
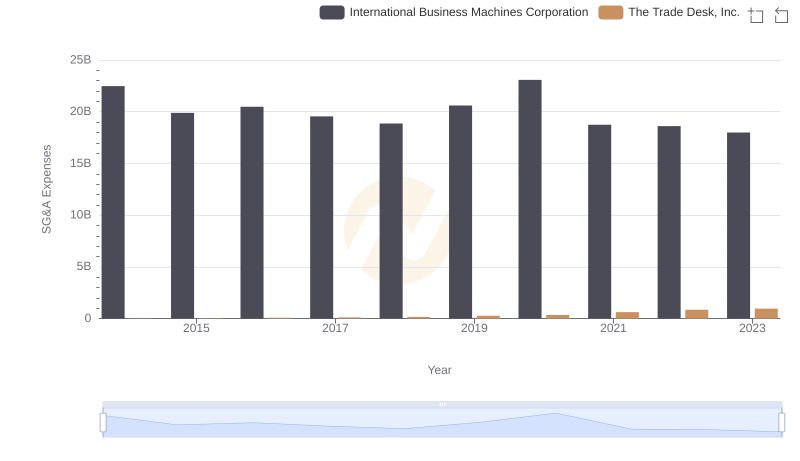
Operational Costs Compared: SG&A Analysis of International Business Machines Corporation and The Trade Desk, Inc.
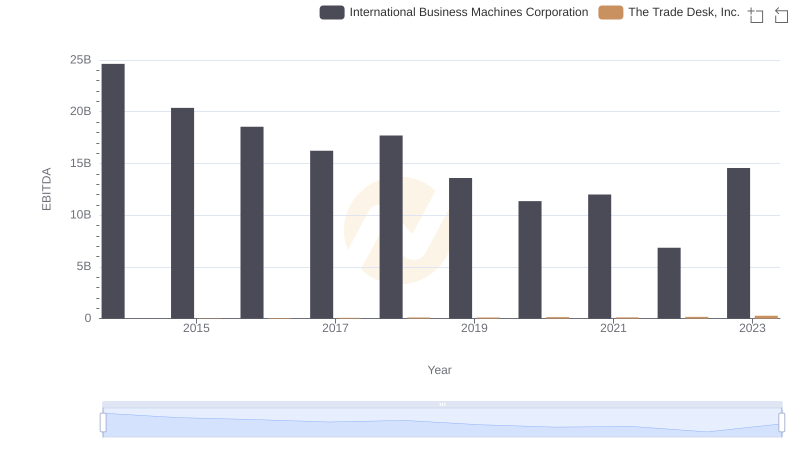
A Professional Review of EBITDA: International Business Machines Corporation Compared to The Trade Desk, Inc.