| __timestamp | International Business Machines Corporation | Workday, Inc. |
|---|---|---|
| Wednesday, January 1, 2014 | 46407000000 | 292128000 |
| Thursday, January 1, 2015 | 40684000000 | 523057000 |
| Friday, January 1, 2016 | 38516000000 | 787919000 |
| Sunday, January 1, 2017 | 36943000000 | 1085862000 |
| Monday, January 1, 2018 | 36936000000 | 1513637000 |
| Tuesday, January 1, 2019 | 31533000000 | 1987230000 |
| Wednesday, January 1, 2020 | 30865000000 | 2561948000 |
| Friday, January 1, 2021 | 31486000000 | 3119864000 |
| Saturday, January 1, 2022 | 32687000000 | 3710703000 |
| Sunday, January 1, 2023 | 34300000000 | 4500640000 |
| Monday, January 1, 2024 | 35551000000 | 5488000000 |
Cracking the code
In the ever-evolving landscape of technology, the financial performance of industry giants like International Business Machines Corporation (IBM) and Workday, Inc. offers a fascinating glimpse into their strategic trajectories. Over the past decade, IBM's gross profit has seen a decline of approximately 24%, from a peak in 2014 to a low in 2021, reflecting the challenges faced by traditional tech behemoths in adapting to new market dynamics. In contrast, Workday, a cloud-based software provider, has experienced a remarkable growth trajectory, with its gross profit increasing nearly 19-fold from 2014 to 2024. This stark contrast highlights the shifting tides in the tech industry, where agile, cloud-native companies are rapidly gaining ground. As we look to the future, the data underscores the importance of innovation and adaptability in maintaining competitive advantage.
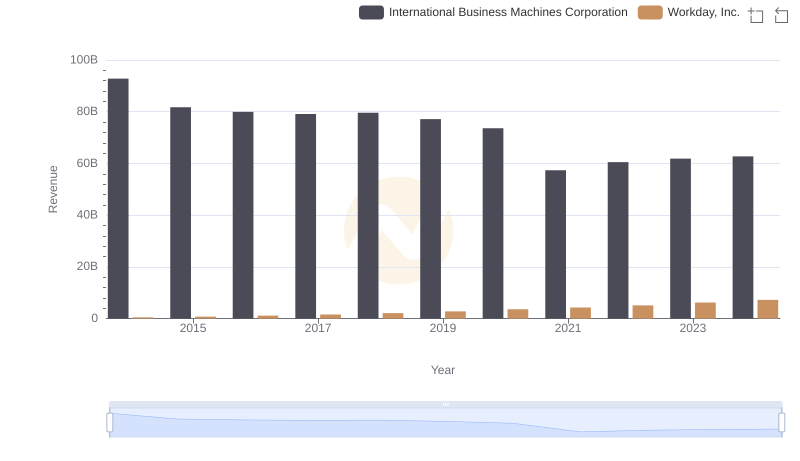
Revenue Insights: International Business Machines Corporation and Workday, Inc. Performance Compared
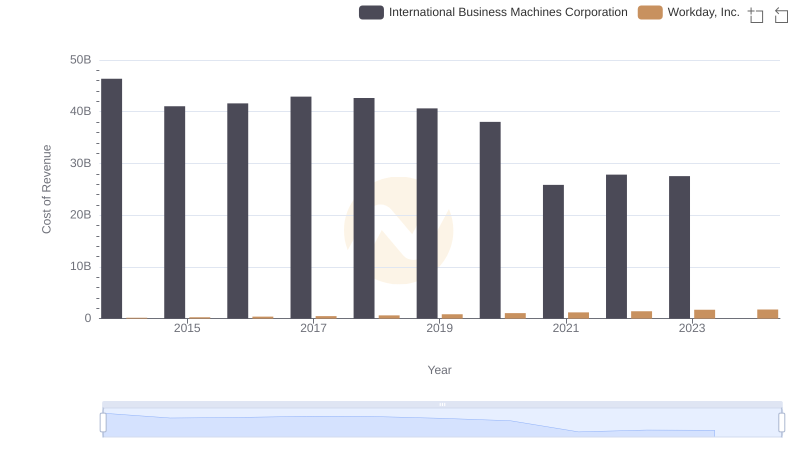
Cost of Revenue Comparison: International Business Machines Corporation vs Workday, Inc.
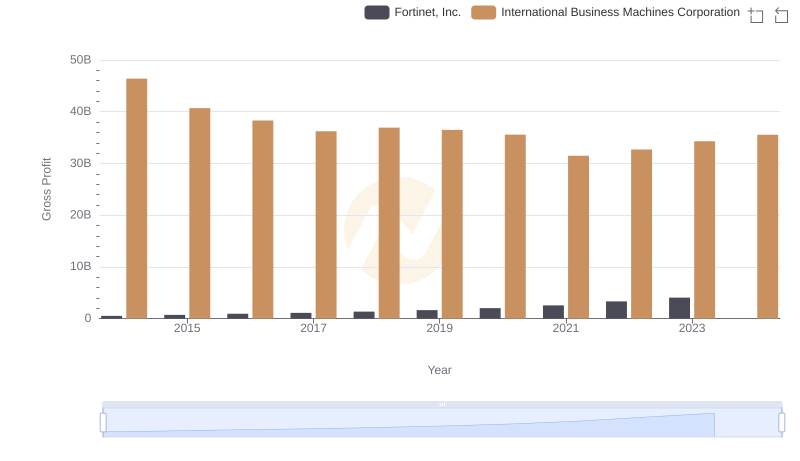
Who Generates Higher Gross Profit? International Business Machines Corporation or Fortinet, Inc.
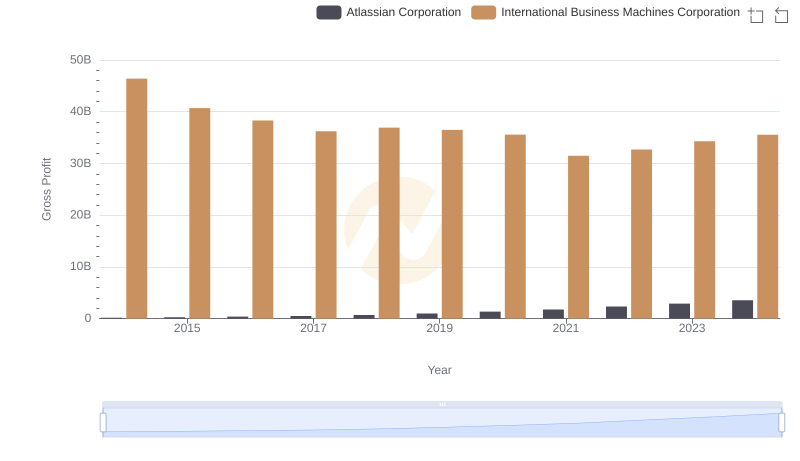
Gross Profit Comparison: International Business Machines Corporation and Atlassian Corporation Trends
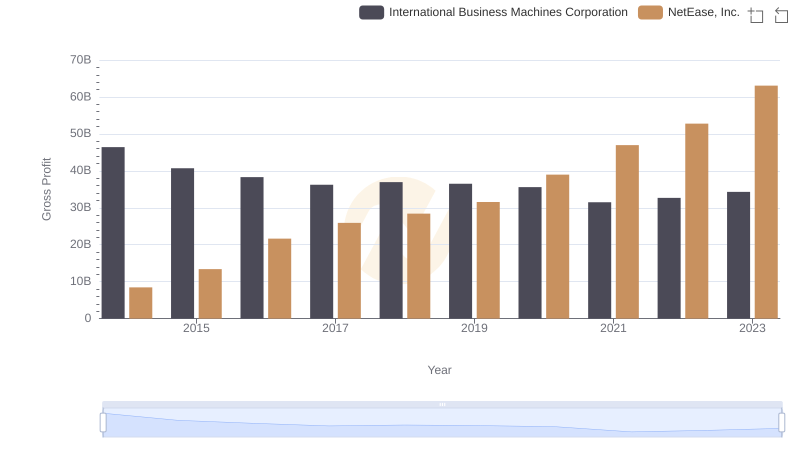
Gross Profit Analysis: Comparing International Business Machines Corporation and NetEase, Inc.
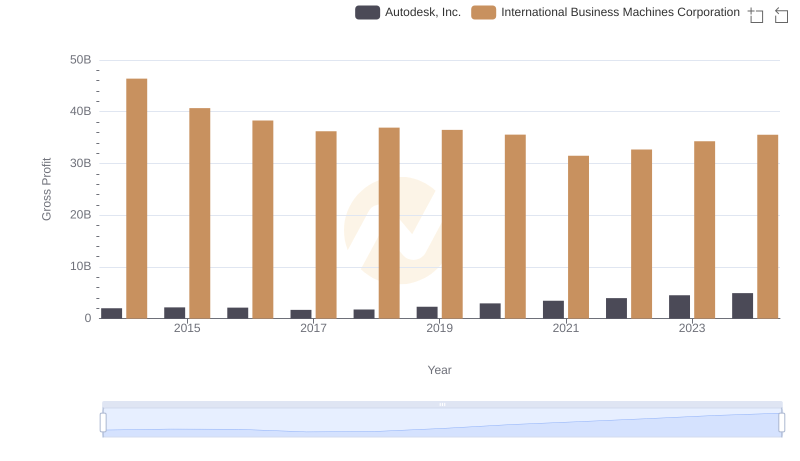
Key Insights on Gross Profit: International Business Machines Corporation vs Autodesk, Inc.
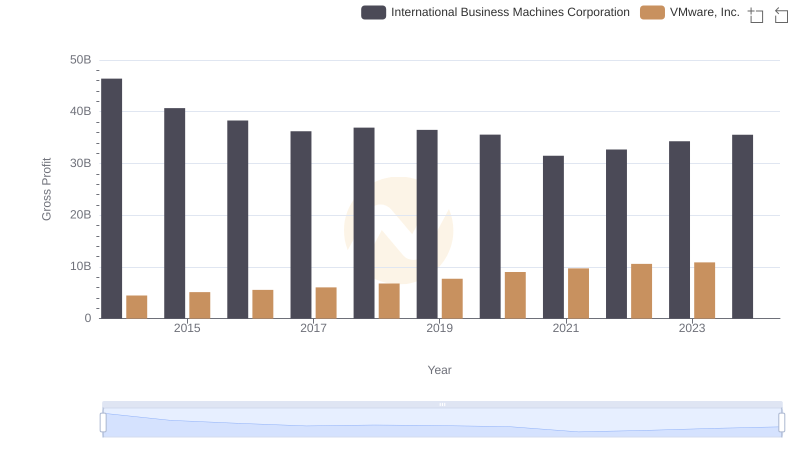
Gross Profit Analysis: Comparing International Business Machines Corporation and VMware, Inc.
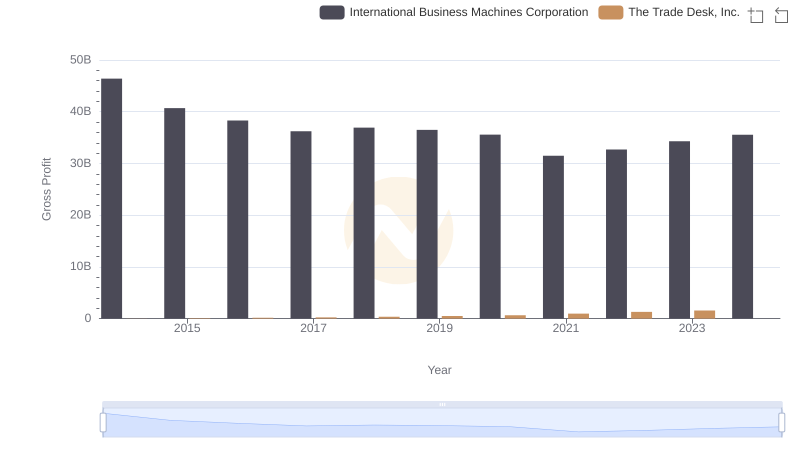
Key Insights on Gross Profit: International Business Machines Corporation vs The Trade Desk, Inc.
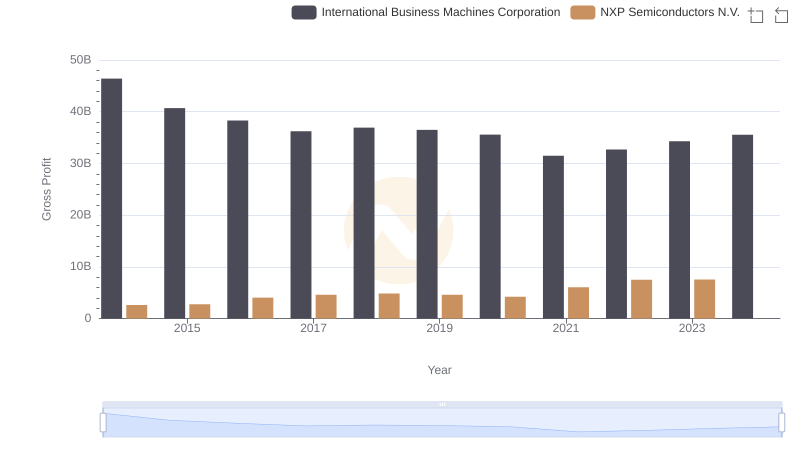
Gross Profit Comparison: International Business Machines Corporation and NXP Semiconductors N.V. Trends
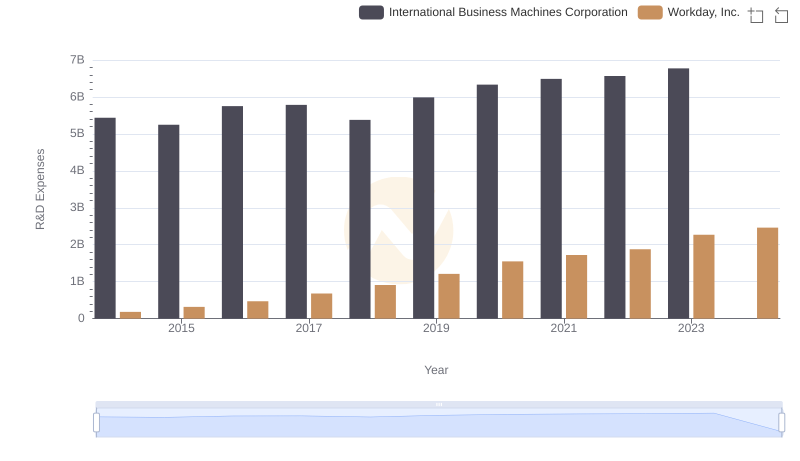
Research and Development Investment: International Business Machines Corporation vs Workday, Inc.
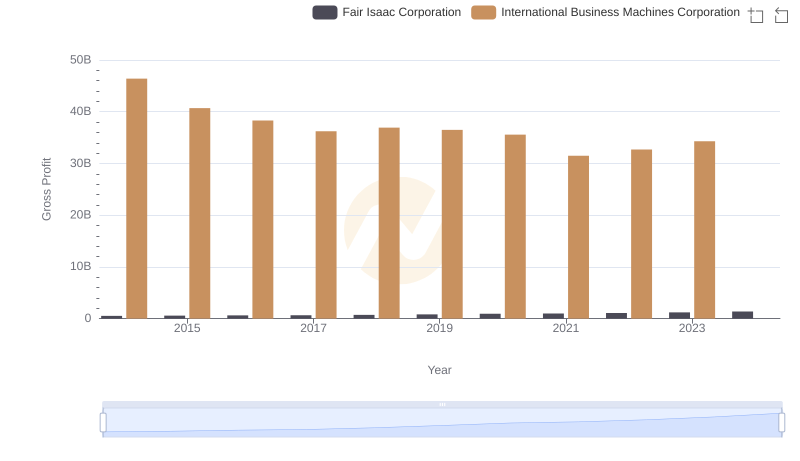
Who Generates Higher Gross Profit? International Business Machines Corporation or Fair Isaac Corporation
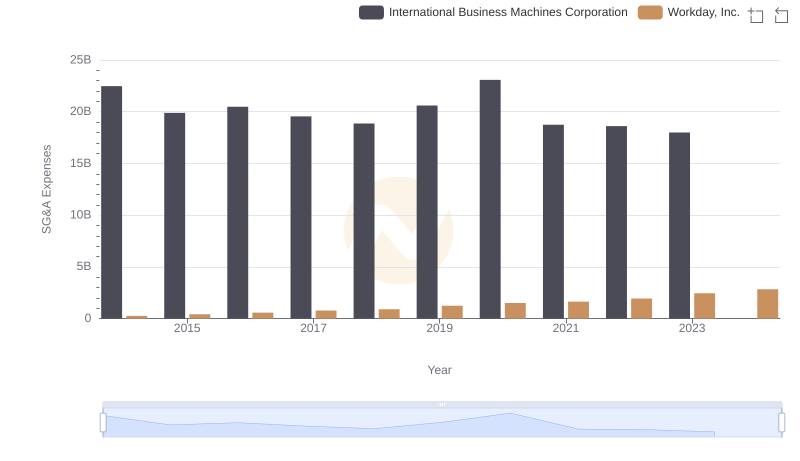
Who Optimizes SG&A Costs Better? International Business Machines Corporation or Workday, Inc.