| __timestamp | EMCOR Group, Inc. | Equifax Inc. |
|---|---|---|
| Wednesday, January 1, 2014 | 907246000 | 1591700000 |
| Thursday, January 1, 2015 | 944479000 | 1776200000 |
| Friday, January 1, 2016 | 1037862000 | 2031500000 |
| Sunday, January 1, 2017 | 1147012000 | 2151500000 |
| Monday, January 1, 2018 | 1205453000 | 1971700000 |
| Tuesday, January 1, 2019 | 1355868000 | 1985900000 |
| Wednesday, January 1, 2020 | 1395382000 | 2390100000 |
| Friday, January 1, 2021 | 1501737000 | 2943000000 |
| Saturday, January 1, 2022 | 1603594000 | 2945000000 |
| Sunday, January 1, 2023 | 2089339000 | 2930100000 |
| Monday, January 1, 2024 | 5681100000 |
Unleashing insights
In the ever-evolving landscape of corporate finance, understanding the trajectory of gross profit is crucial for investors and analysts alike. Over the past decade, Equifax Inc. and EMCOR Group, Inc. have demonstrated notable growth in their gross profits, reflecting their strategic prowess and market adaptability.
From 2014 to 2023, Equifax Inc. saw its gross profit soar by approximately 84%, peaking in 2022 with a remarkable $2.95 billion. This growth underscores Equifax's resilience and ability to capitalize on market opportunities, even amidst economic fluctuations.
Meanwhile, EMCOR Group, Inc. experienced a substantial 130% increase in gross profit over the same period, reaching a high of $2.09 billion in 2023. This impressive growth trajectory highlights EMCOR's strategic expansion and operational efficiency.
These insights provide a compelling narrative of financial growth and strategic success, offering valuable lessons for businesses aiming to thrive in competitive markets.
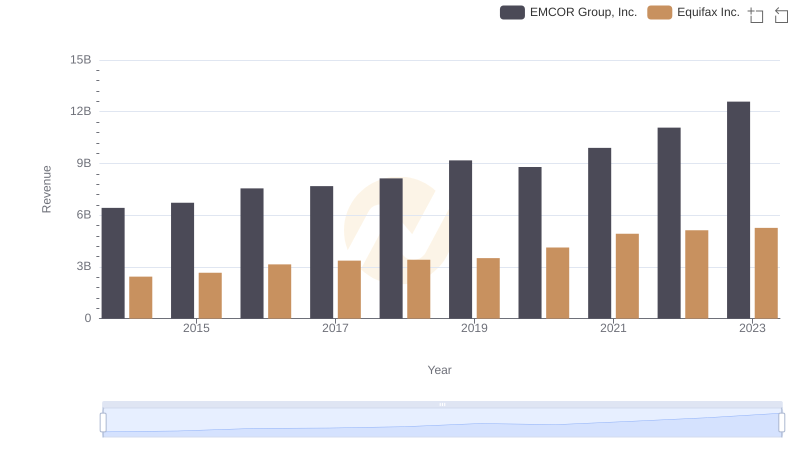
Breaking Down Revenue Trends: Equifax Inc. vs EMCOR Group, Inc.
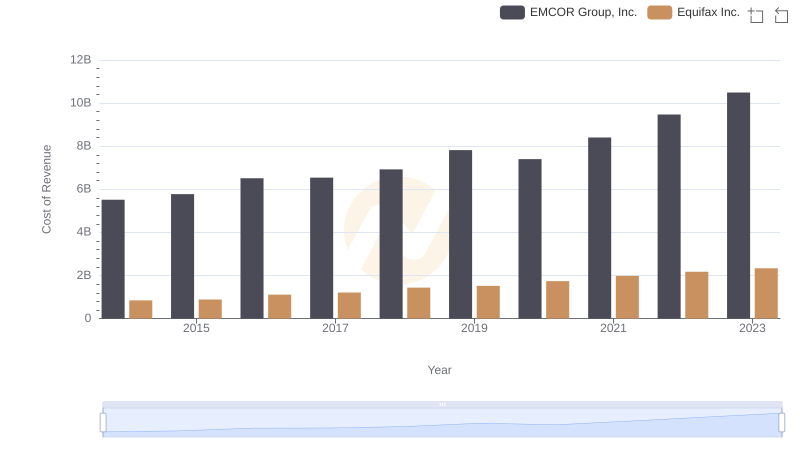
Equifax Inc. vs EMCOR Group, Inc.: Efficiency in Cost of Revenue Explored
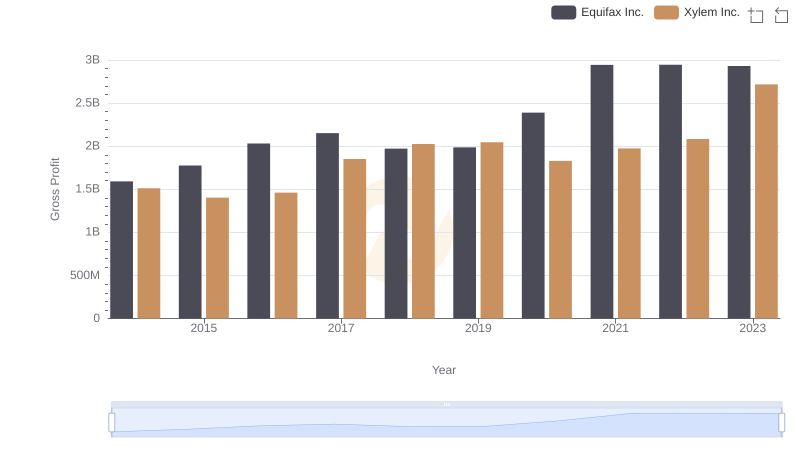
Gross Profit Trends Compared: Equifax Inc. vs Xylem Inc.
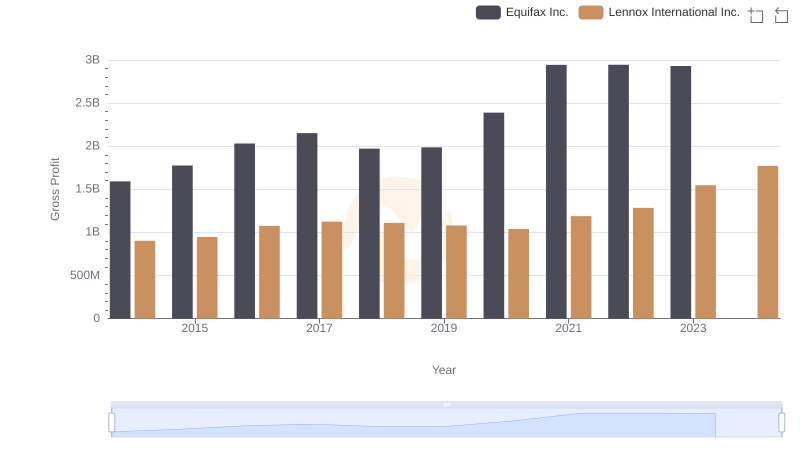
Equifax Inc. vs Lennox International Inc.: A Gross Profit Performance Breakdown
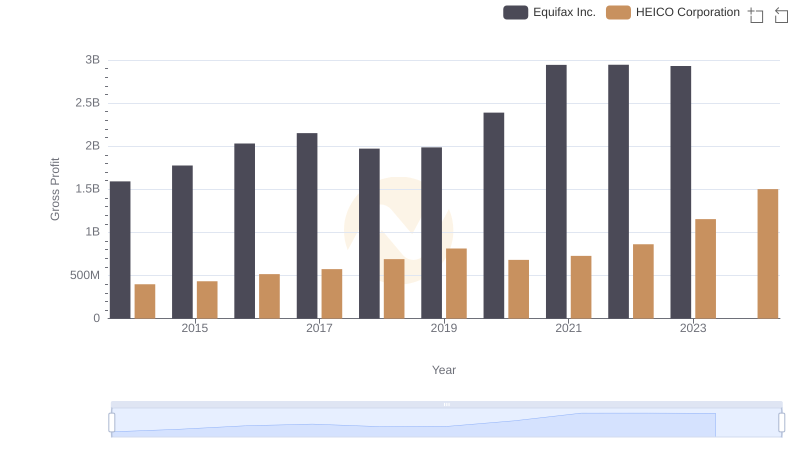
Gross Profit Comparison: Equifax Inc. and HEICO Corporation Trends
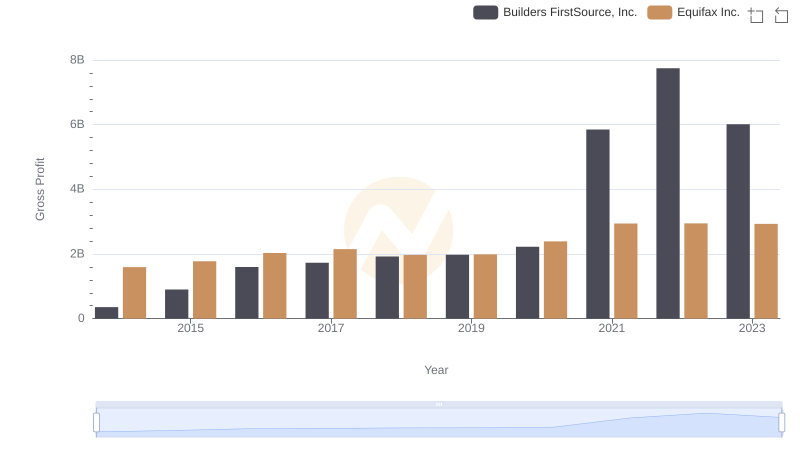
Key Insights on Gross Profit: Equifax Inc. vs Builders FirstSource, Inc.
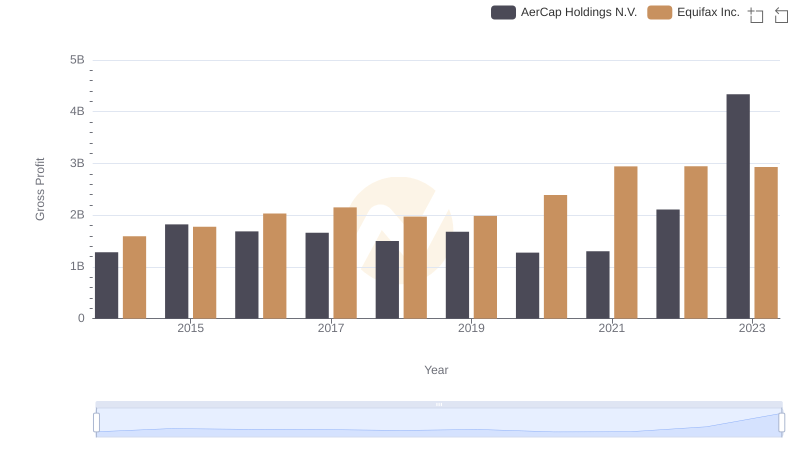
Key Insights on Gross Profit: Equifax Inc. vs AerCap Holdings N.V.
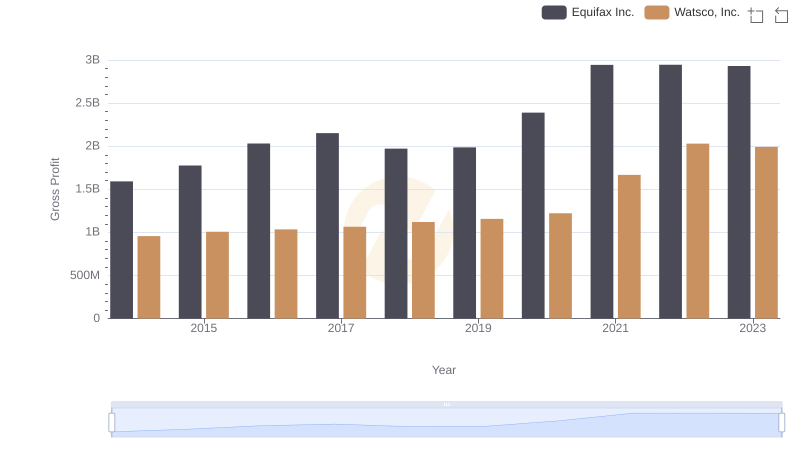
Equifax Inc. vs Watsco, Inc.: A Gross Profit Performance Breakdown
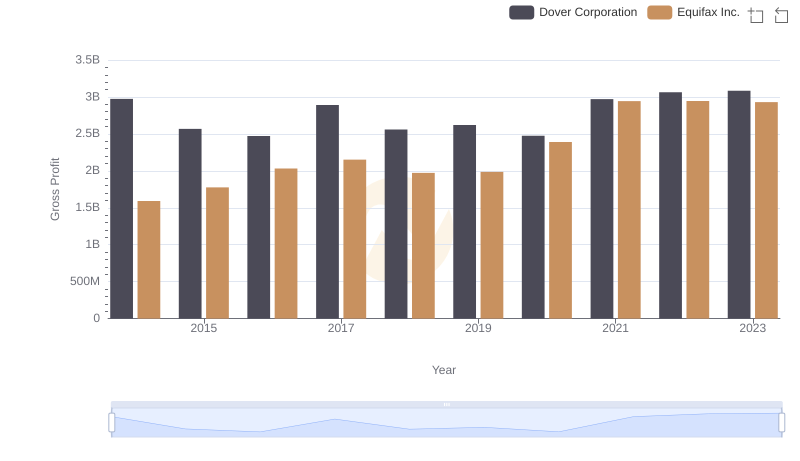
Equifax Inc. vs Dover Corporation: A Gross Profit Performance Breakdown
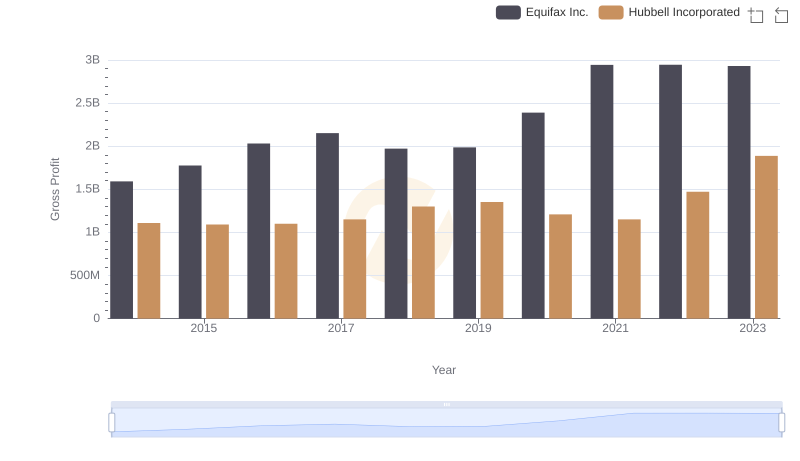
Equifax Inc. vs Hubbell Incorporated: A Gross Profit Performance Breakdown
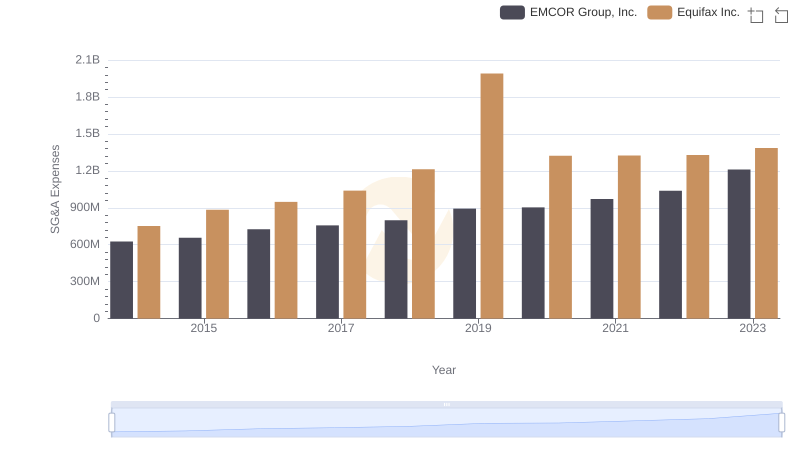
Breaking Down SG&A Expenses: Equifax Inc. vs EMCOR Group, Inc.
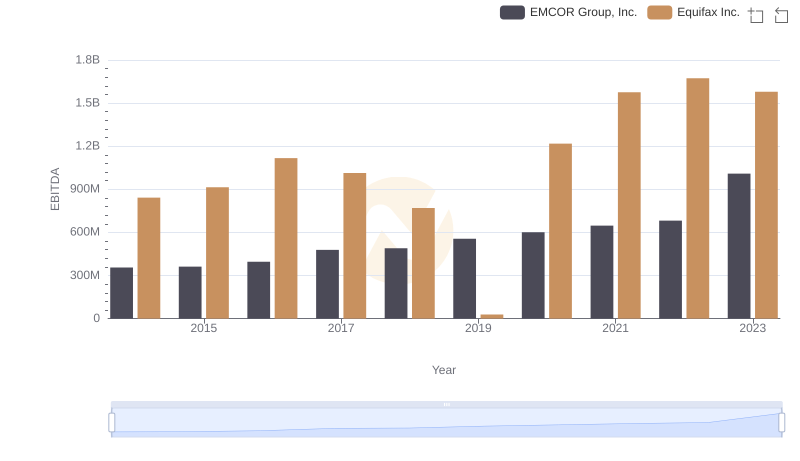
Equifax Inc. and EMCOR Group, Inc.: A Detailed Examination of EBITDA Performance