| __timestamp | Equifax Inc. | HEICO Corporation |
|---|---|---|
| Wednesday, January 1, 2014 | 1591700000 | 398312000 |
| Thursday, January 1, 2015 | 1776200000 | 434179000 |
| Friday, January 1, 2016 | 2031500000 | 515492000 |
| Sunday, January 1, 2017 | 2151500000 | 574725000 |
| Monday, January 1, 2018 | 1971700000 | 690715000 |
| Tuesday, January 1, 2019 | 1985900000 | 813840000 |
| Wednesday, January 1, 2020 | 2390100000 | 682127000 |
| Friday, January 1, 2021 | 2943000000 | 727423000 |
| Saturday, January 1, 2022 | 2945000000 | 862759000 |
| Sunday, January 1, 2023 | 2930100000 | 1153488000 |
| Monday, January 1, 2024 | 5681100000 | 1501726000 |
Cracking the code
In the ever-evolving landscape of the financial sector, understanding the gross profit trends of major corporations provides valuable insights into their economic health and strategic positioning. From 2014 to 2023, Equifax Inc. and HEICO Corporation have showcased distinct trajectories in their gross profit margins. Equifax Inc. experienced a robust growth of approximately 84% from 2014 to 2023, peaking in 2022 with a gross profit of nearly $2.95 billion. However, 2023 saw a slight dip, indicating potential market challenges or strategic shifts.
Conversely, HEICO Corporation demonstrated a consistent upward trend, with a remarkable 190% increase over the same period, culminating in a gross profit of $1.15 billion in 2023. This growth trajectory highlights HEICO's strategic prowess in navigating market dynamics. Notably, data for Equifax in 2024 is missing, suggesting a need for further analysis to understand future trends.
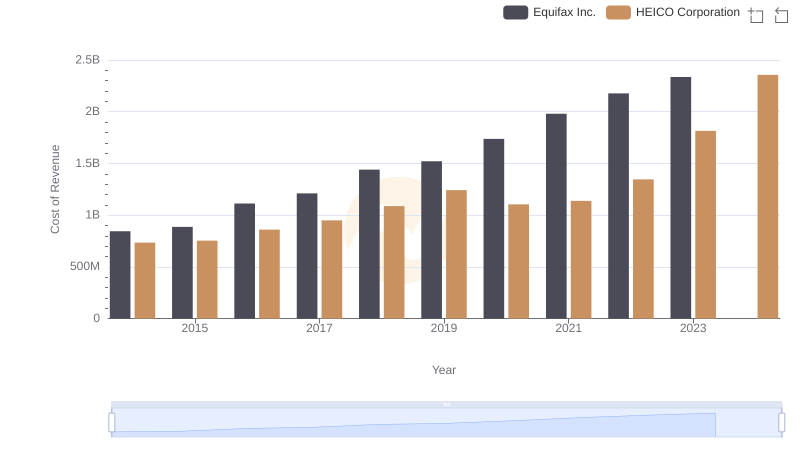
Equifax Inc. vs HEICO Corporation: Efficiency in Cost of Revenue Explored
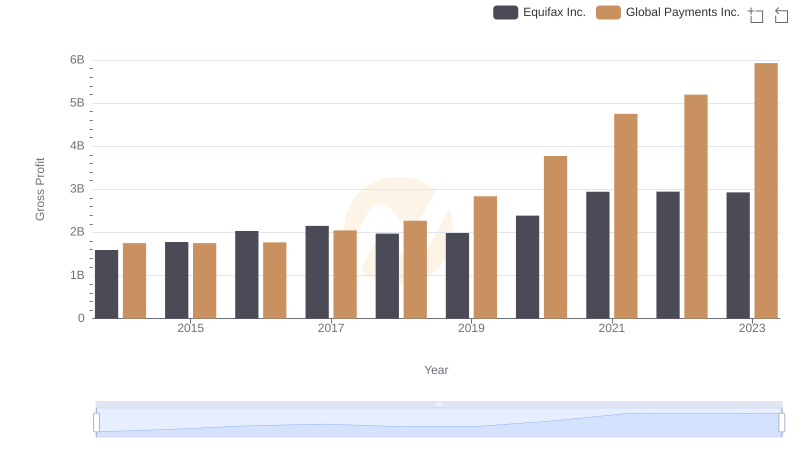
Who Generates Higher Gross Profit? Equifax Inc. or Global Payments Inc.
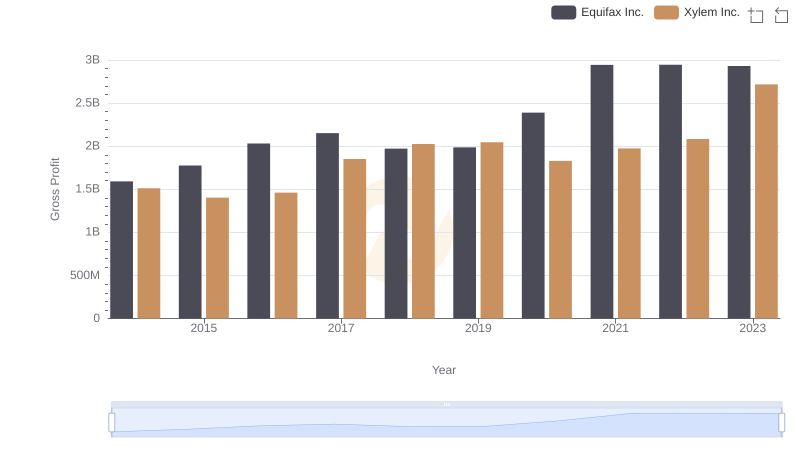
Gross Profit Trends Compared: Equifax Inc. vs Xylem Inc.
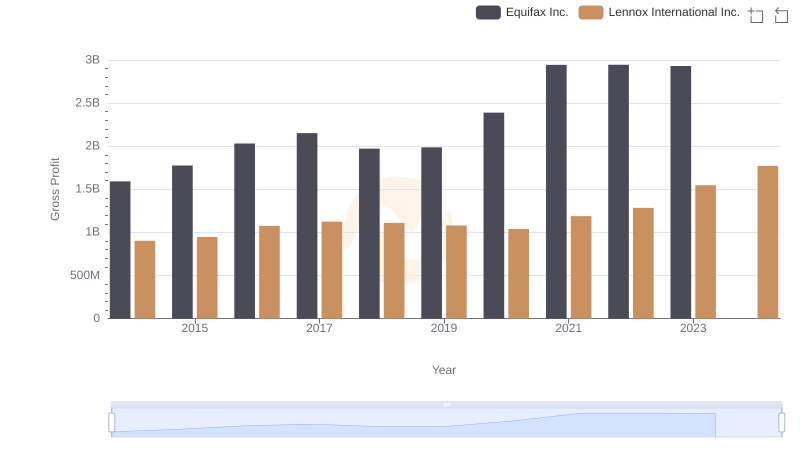
Equifax Inc. vs Lennox International Inc.: A Gross Profit Performance Breakdown
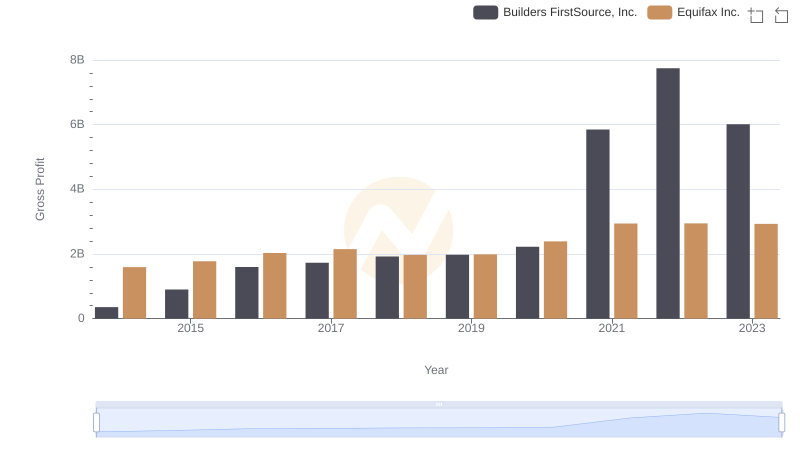
Key Insights on Gross Profit: Equifax Inc. vs Builders FirstSource, Inc.
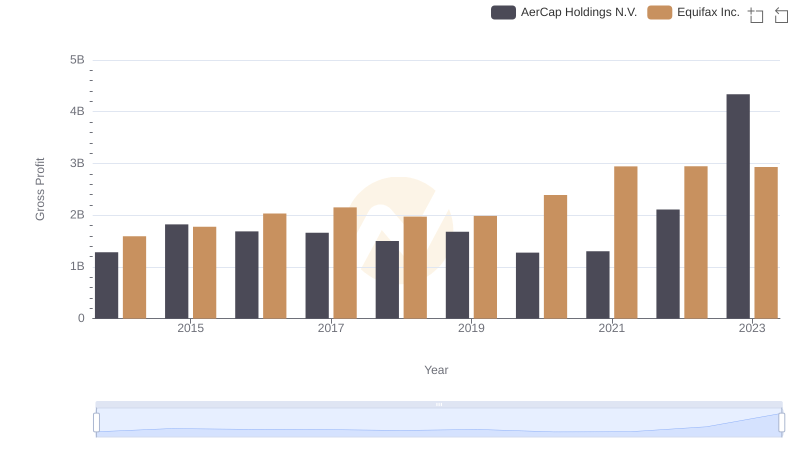
Key Insights on Gross Profit: Equifax Inc. vs AerCap Holdings N.V.
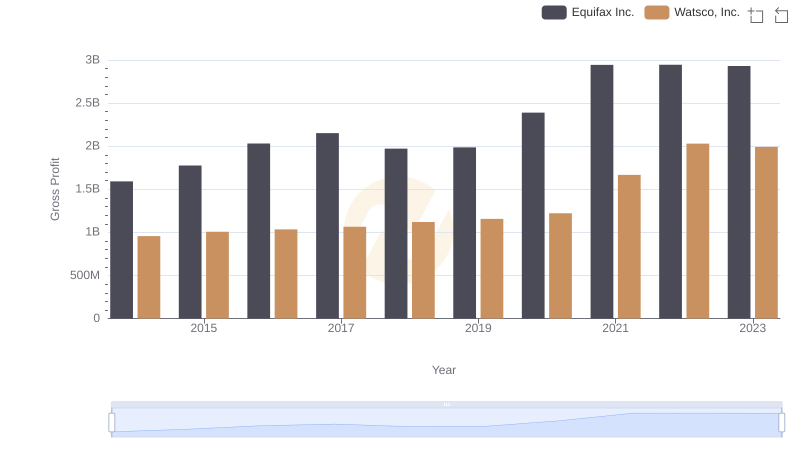
Equifax Inc. vs Watsco, Inc.: A Gross Profit Performance Breakdown
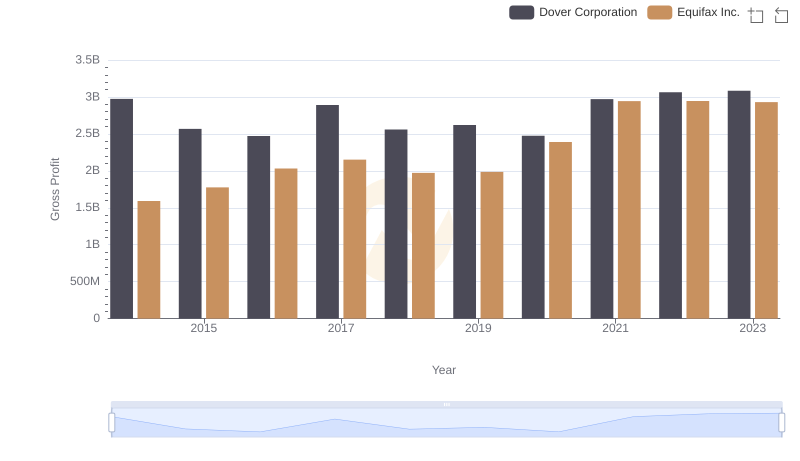
Equifax Inc. vs Dover Corporation: A Gross Profit Performance Breakdown
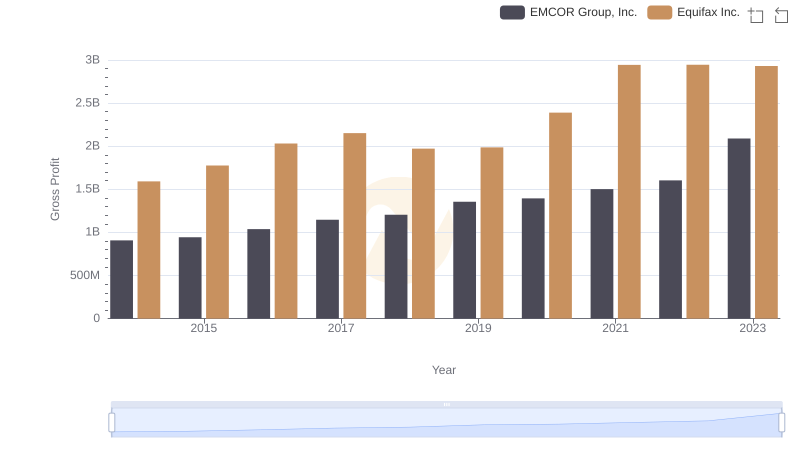
Key Insights on Gross Profit: Equifax Inc. vs EMCOR Group, Inc.
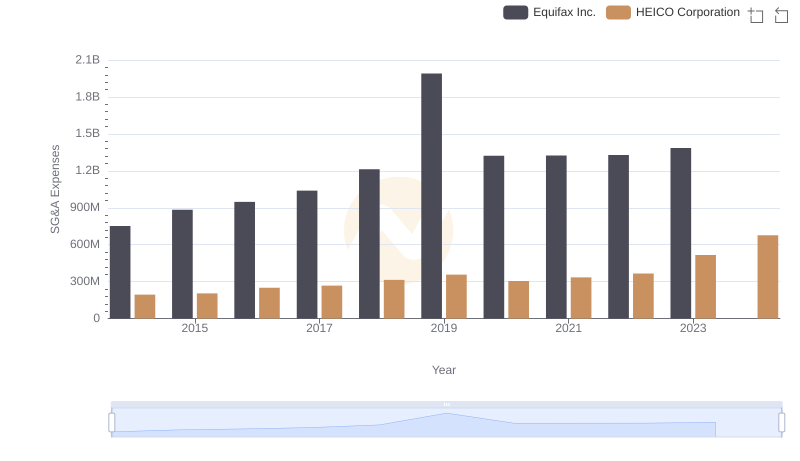
Comparing SG&A Expenses: Equifax Inc. vs HEICO Corporation Trends and Insights