| __timestamp | Equifax Inc. | Xylem Inc. |
|---|---|---|
| Wednesday, January 1, 2014 | 1591700000 | 1513000000 |
| Thursday, January 1, 2015 | 1776200000 | 1404000000 |
| Friday, January 1, 2016 | 2031500000 | 1461000000 |
| Sunday, January 1, 2017 | 2151500000 | 1851000000 |
| Monday, January 1, 2018 | 1971700000 | 2026000000 |
| Tuesday, January 1, 2019 | 1985900000 | 2046000000 |
| Wednesday, January 1, 2020 | 2390100000 | 1830000000 |
| Friday, January 1, 2021 | 2943000000 | 1975000000 |
| Saturday, January 1, 2022 | 2945000000 | 2084000000 |
| Sunday, January 1, 2023 | 2930100000 | 2717000000 |
| Monday, January 1, 2024 | 5681100000 |
Unveiling the hidden dimensions of data
In the ever-evolving landscape of corporate finance, understanding the trajectory of gross profits is crucial for investors and stakeholders. From 2014 to 2023, Equifax Inc. and Xylem Inc. have shown distinct financial paths. Equifax, a leader in consumer credit reporting, saw its gross profit grow by approximately 84% over this period, peaking in 2022 with a remarkable $2.94 billion. Meanwhile, Xylem Inc., a global water technology provider, experienced a 79% increase, reaching its highest gross profit of $2.72 billion in 2023. Notably, Xylem's gross profit surpassed Equifax's in 2018 and 2019, highlighting its resilience and growth in the water sector. These trends underscore the dynamic nature of these industries and the importance of strategic financial management. As we look to the future, monitoring these trends will be key to understanding the broader economic landscape.
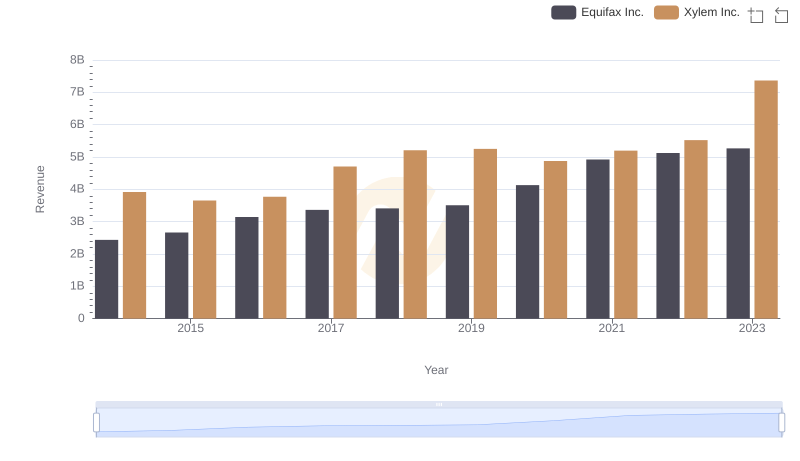
Annual Revenue Comparison: Equifax Inc. vs Xylem Inc.
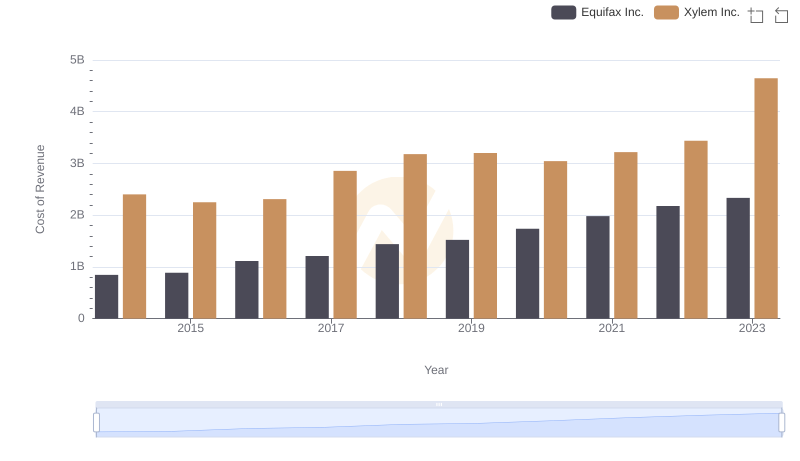
Analyzing Cost of Revenue: Equifax Inc. and Xylem Inc.
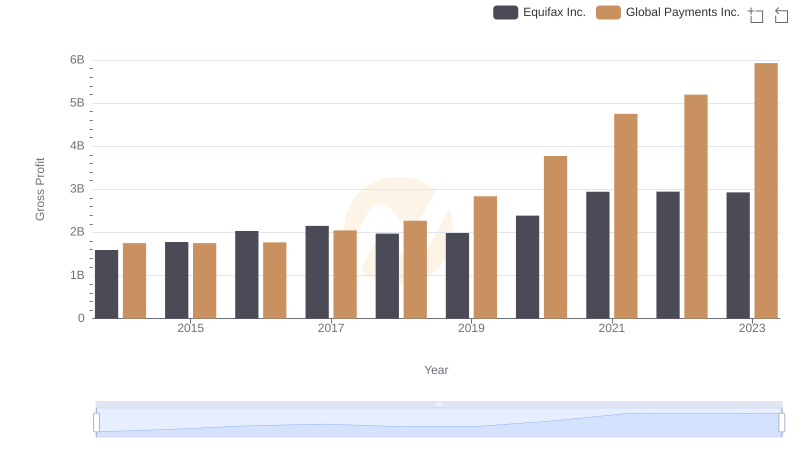
Who Generates Higher Gross Profit? Equifax Inc. or Global Payments Inc.
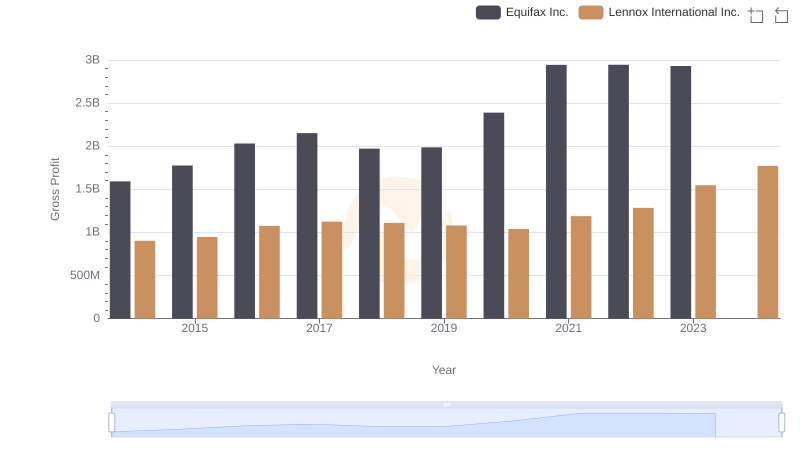
Equifax Inc. vs Lennox International Inc.: A Gross Profit Performance Breakdown
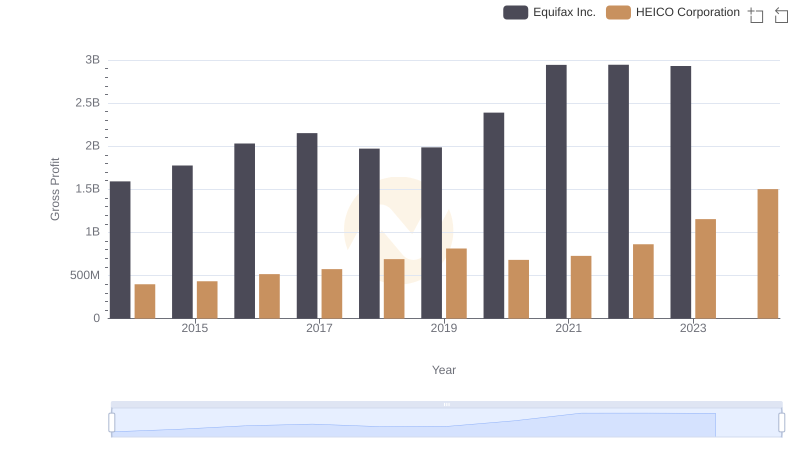
Gross Profit Comparison: Equifax Inc. and HEICO Corporation Trends
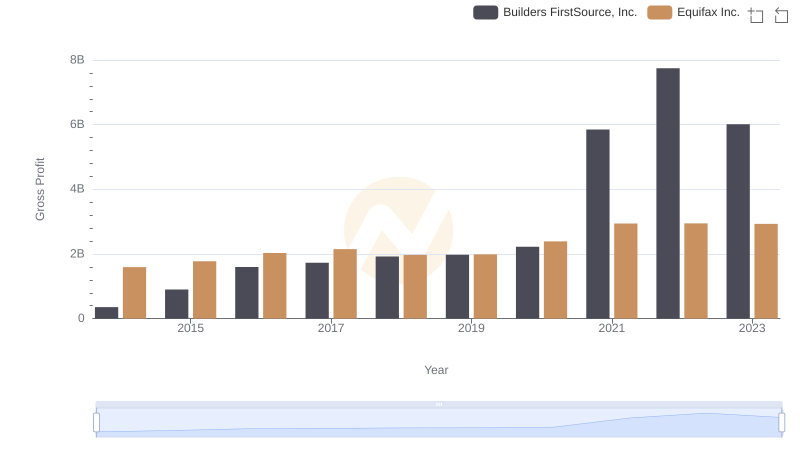
Key Insights on Gross Profit: Equifax Inc. vs Builders FirstSource, Inc.
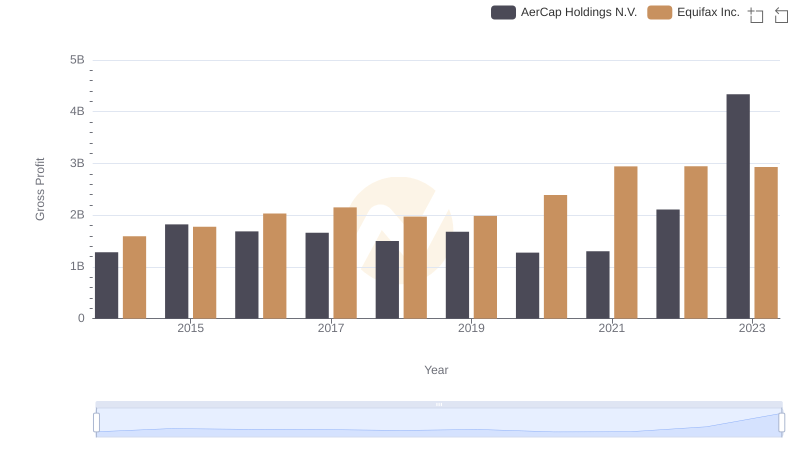
Key Insights on Gross Profit: Equifax Inc. vs AerCap Holdings N.V.
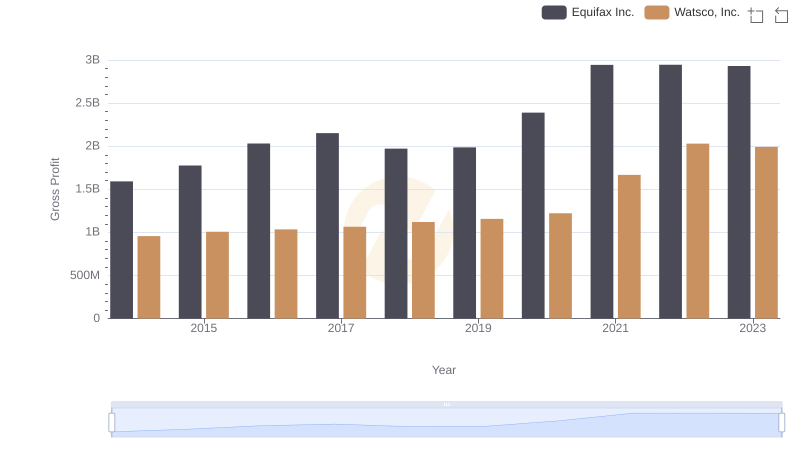
Equifax Inc. vs Watsco, Inc.: A Gross Profit Performance Breakdown
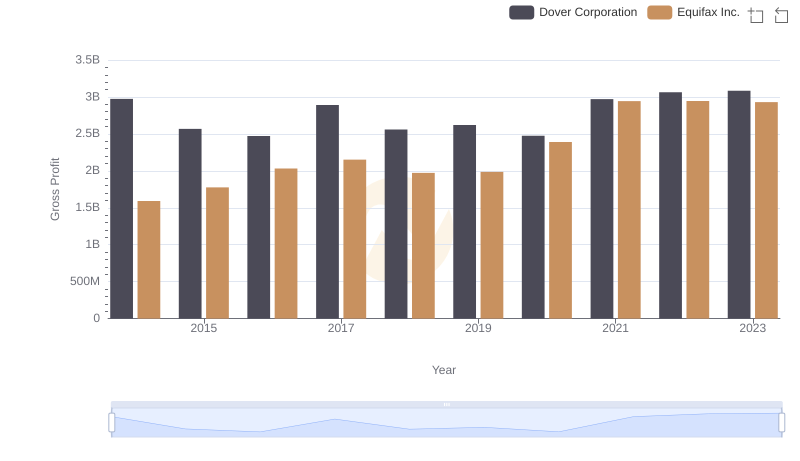
Equifax Inc. vs Dover Corporation: A Gross Profit Performance Breakdown
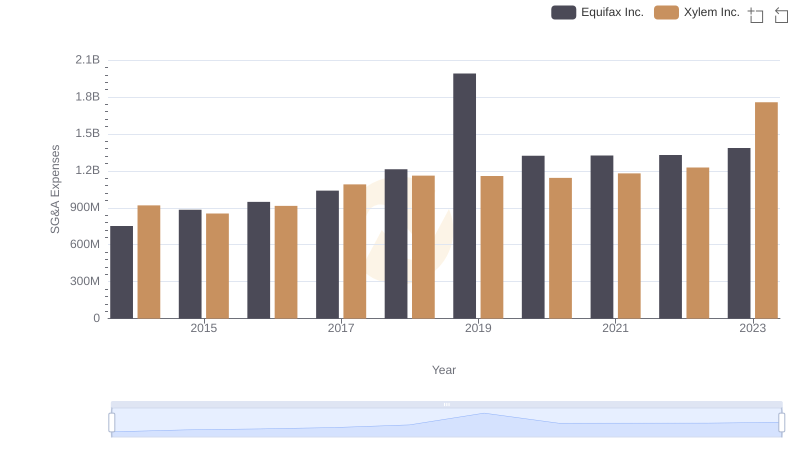
Equifax Inc. or Xylem Inc.: Who Manages SG&A Costs Better?