| __timestamp | EMCOR Group, Inc. | Equifax Inc. |
|---|---|---|
| Wednesday, January 1, 2014 | 355858000 | 842400000 |
| Thursday, January 1, 2015 | 362095000 | 914600000 |
| Friday, January 1, 2016 | 395913000 | 1116900000 |
| Sunday, January 1, 2017 | 478459000 | 1013900000 |
| Monday, January 1, 2018 | 489954000 | 770200000 |
| Tuesday, January 1, 2019 | 556055000 | 29000000 |
| Wednesday, January 1, 2020 | 601449000 | 1217800000 |
| Friday, January 1, 2021 | 646861000 | 1575200000 |
| Saturday, January 1, 2022 | 682399000 | 1672800000 |
| Sunday, January 1, 2023 | 1009017000 | 1579100000 |
| Monday, January 1, 2024 | 1251200000 |
Infusing magic into the data realm
In the ever-evolving landscape of corporate finance, EBITDA serves as a crucial indicator of a company's operational efficiency. From 2014 to 2023, Equifax Inc. and EMCOR Group, Inc. have demonstrated intriguing trends in their EBITDA performance. Equifax Inc. experienced a remarkable growth of approximately 87% over this period, peaking in 2022. However, 2019 was an anomaly with a significant dip, likely due to external market factors. In contrast, EMCOR Group, Inc. showcased a steady upward trajectory, culminating in a 184% increase by 2023. This consistent growth underscores EMCOR's robust operational strategies. The data reveals that while Equifax's EBITDA fluctuated, EMCOR's resilience and adaptability in the market have been commendable. As we delve deeper into these financial narratives, it becomes evident that strategic foresight and market adaptability are key to sustained financial success.
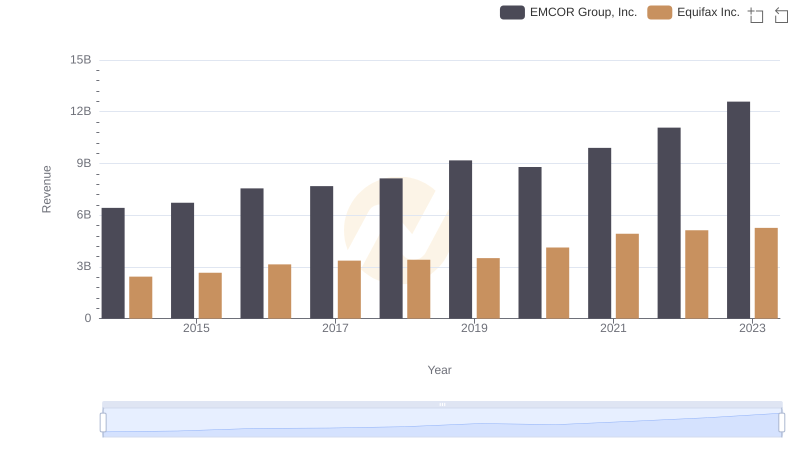
Breaking Down Revenue Trends: Equifax Inc. vs EMCOR Group, Inc.
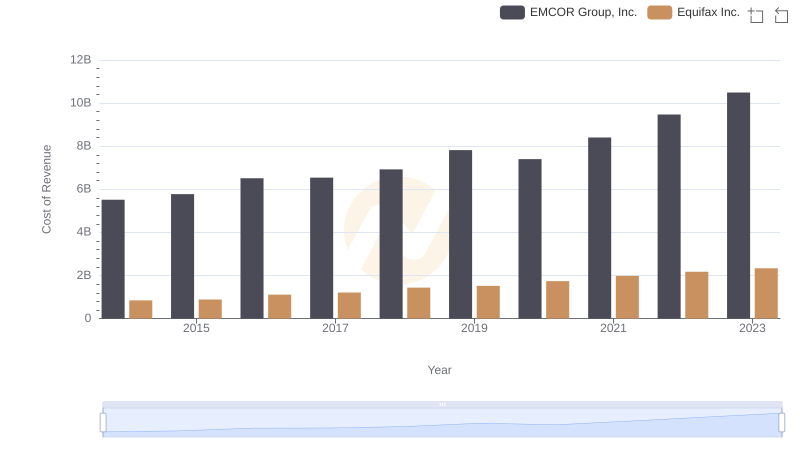
Equifax Inc. vs EMCOR Group, Inc.: Efficiency in Cost of Revenue Explored
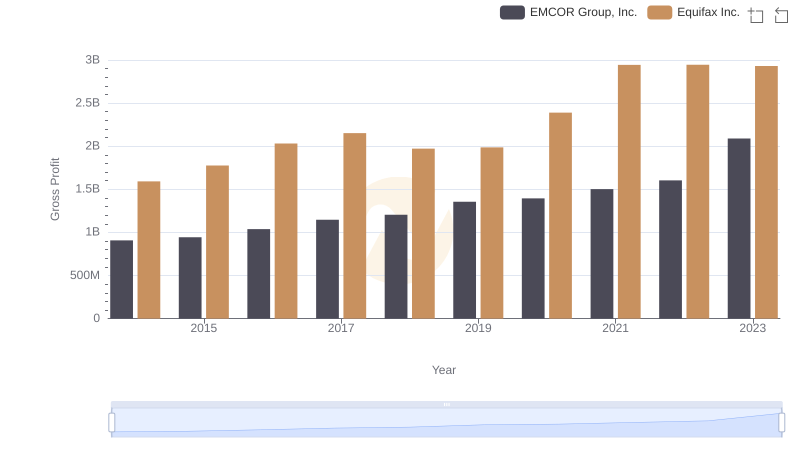
Key Insights on Gross Profit: Equifax Inc. vs EMCOR Group, Inc.
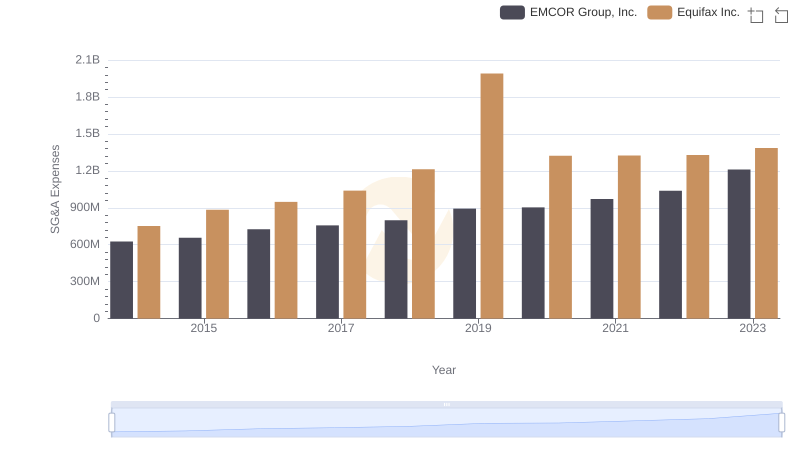
Breaking Down SG&A Expenses: Equifax Inc. vs EMCOR Group, Inc.
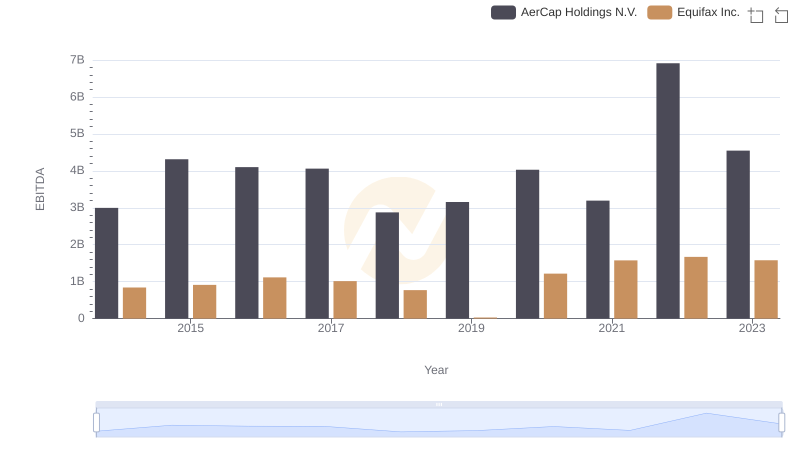
A Side-by-Side Analysis of EBITDA: Equifax Inc. and AerCap Holdings N.V.
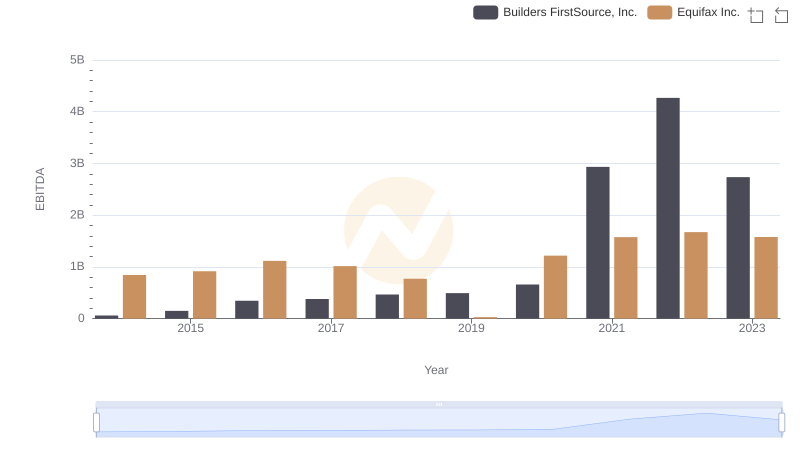
Comparative EBITDA Analysis: Equifax Inc. vs Builders FirstSource, Inc.