| __timestamp | Gartner, Inc. | Intuit Inc. |
|---|---|---|
| Wednesday, January 1, 2014 | 2021441000 | 4506000000 |
| Thursday, January 1, 2015 | 2163056000 | 4192000000 |
| Friday, January 1, 2016 | 2444540000 | 4694000000 |
| Sunday, January 1, 2017 | 3311494000 | 5177000000 |
| Monday, January 1, 2018 | 3975454000 | 5964000000 |
| Tuesday, January 1, 2019 | 4245321000 | 6784000000 |
| Wednesday, January 1, 2020 | 4099444000 | 7679000000 |
| Friday, January 1, 2021 | 4733939000 | 9633000000 |
| Saturday, January 1, 2022 | 5475829000 | 12726000000 |
| Sunday, January 1, 2023 | 5906956000 | 14368000000 |
| Monday, January 1, 2024 | 6267411000 | 16285000000 |
Unlocking the unknown
In the ever-evolving landscape of technology and research, Intuit Inc. and Gartner, Inc. have emerged as industry leaders. Over the past decade, Intuit's revenue has surged by approximately 220%, reflecting its robust growth trajectory. Starting from 2014, Intuit's revenue consistently climbed, reaching a peak of $14.37 billion in 2023. This growth underscores Intuit's strategic innovations in financial software solutions.
Conversely, Gartner, Inc. has demonstrated a steady revenue increase of around 190% over the same period. From $2.02 billion in 2014, Gartner's revenue reached $5.91 billion in 2023, highlighting its pivotal role in providing valuable insights and advisory services.
While Intuit's revenue data for 2024 is available, Gartner's is notably absent, leaving room for speculation about its future performance. This analysis offers a compelling glimpse into the financial trajectories of these two giants, setting the stage for future market dynamics.
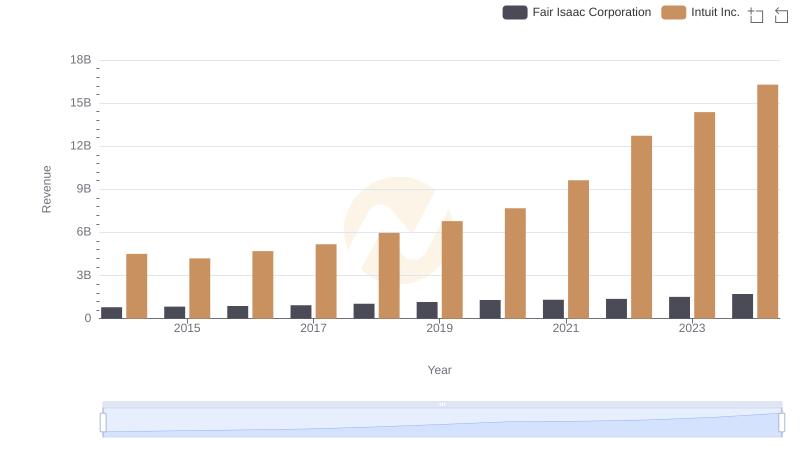
Revenue Insights: Intuit Inc. and Fair Isaac Corporation Performance Compared
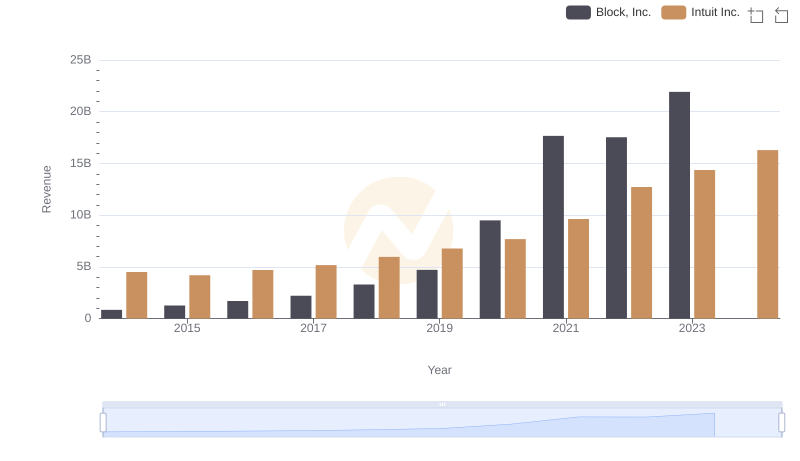
Breaking Down Revenue Trends: Intuit Inc. vs Block, Inc.
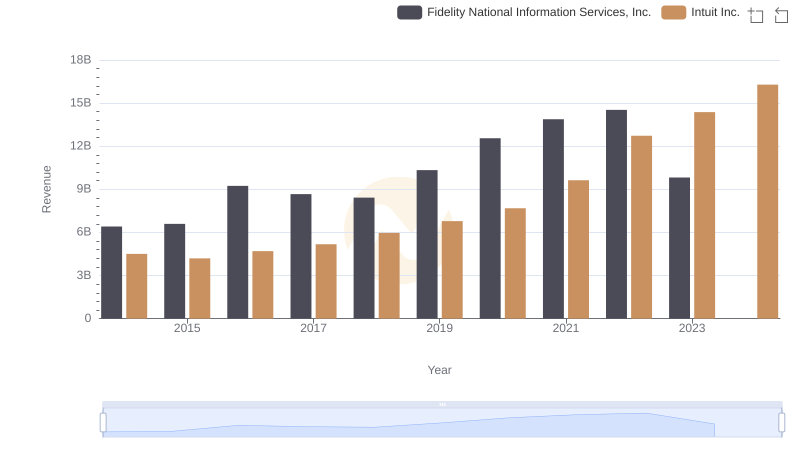
Revenue Insights: Intuit Inc. and Fidelity National Information Services, Inc. Performance Compared
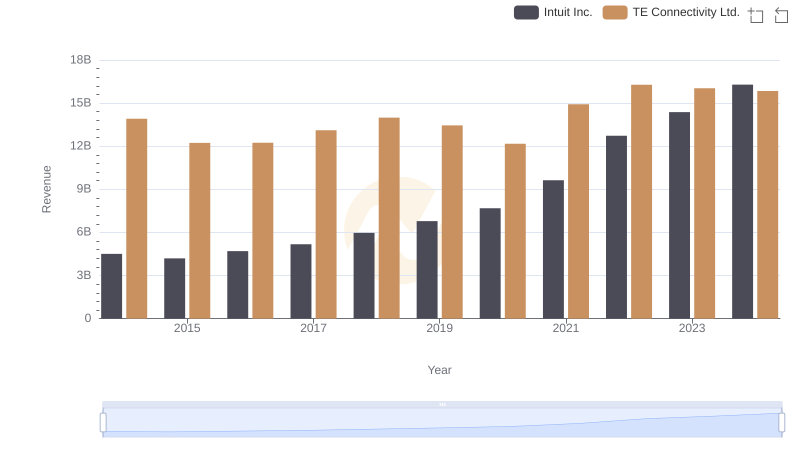
Annual Revenue Comparison: Intuit Inc. vs TE Connectivity Ltd.
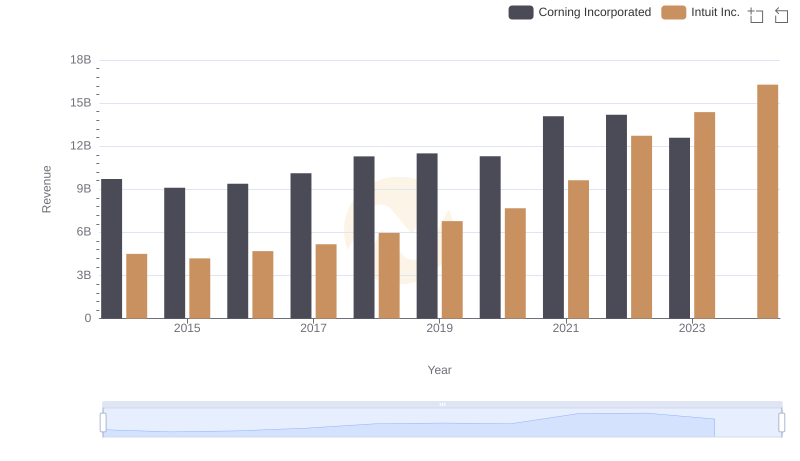
Intuit Inc. vs Corning Incorporated: Examining Key Revenue Metrics
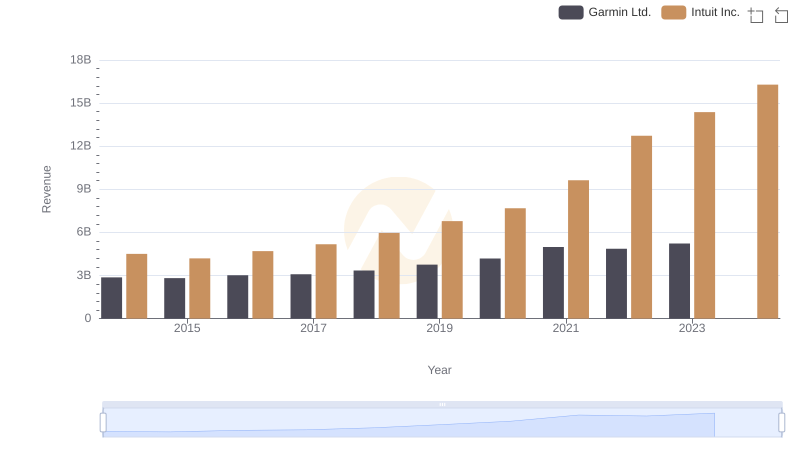
Revenue Showdown: Intuit Inc. vs Garmin Ltd.
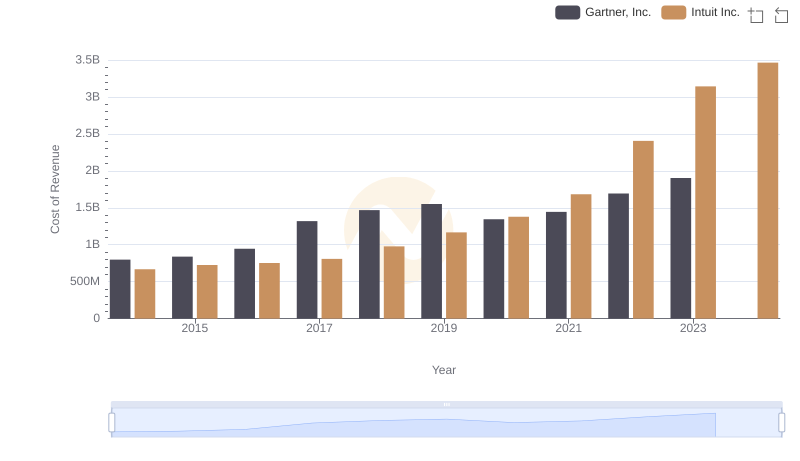
Intuit Inc. vs Gartner, Inc.: Efficiency in Cost of Revenue Explored
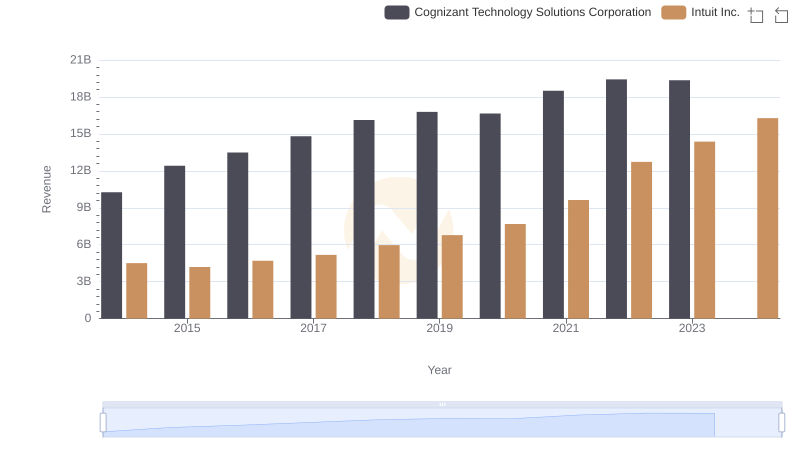
Revenue Insights: Intuit Inc. and Cognizant Technology Solutions Corporation Performance Compared
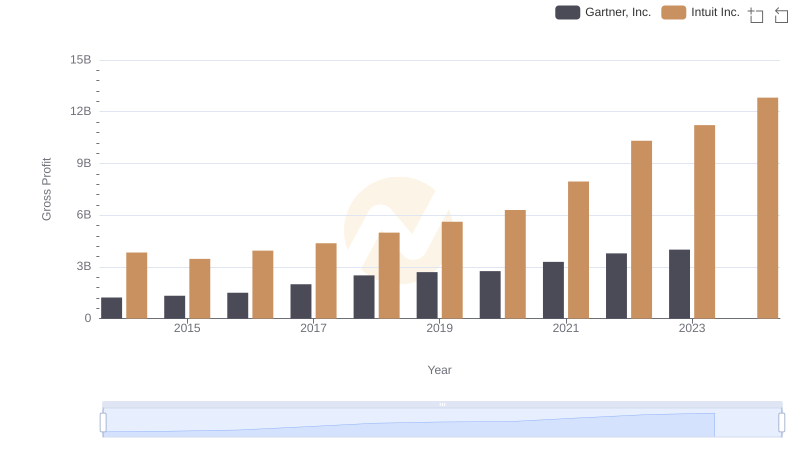
Who Generates Higher Gross Profit? Intuit Inc. or Gartner, Inc.
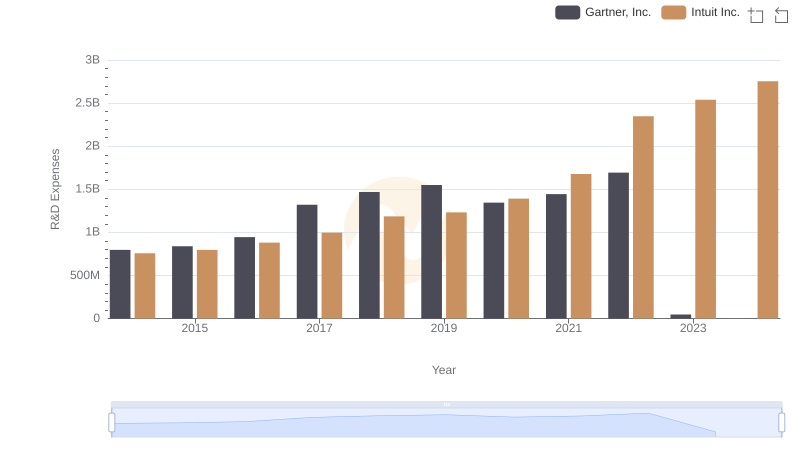
Intuit Inc. vs Gartner, Inc.: Strategic Focus on R&D Spending
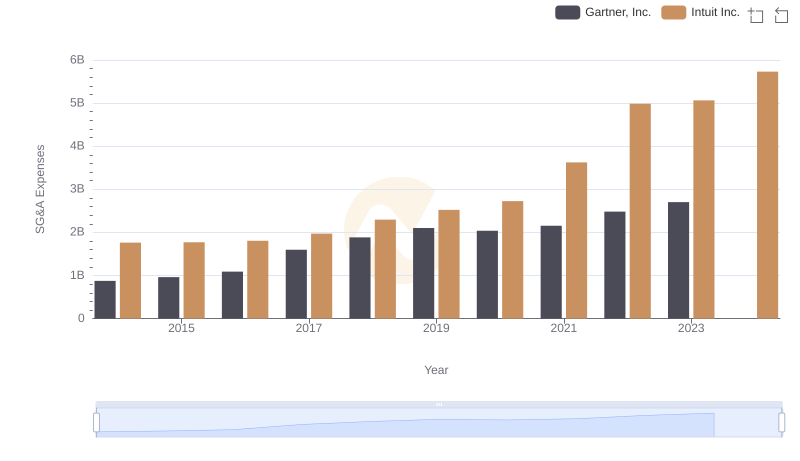
Intuit Inc. vs Gartner, Inc.: SG&A Expense Trends
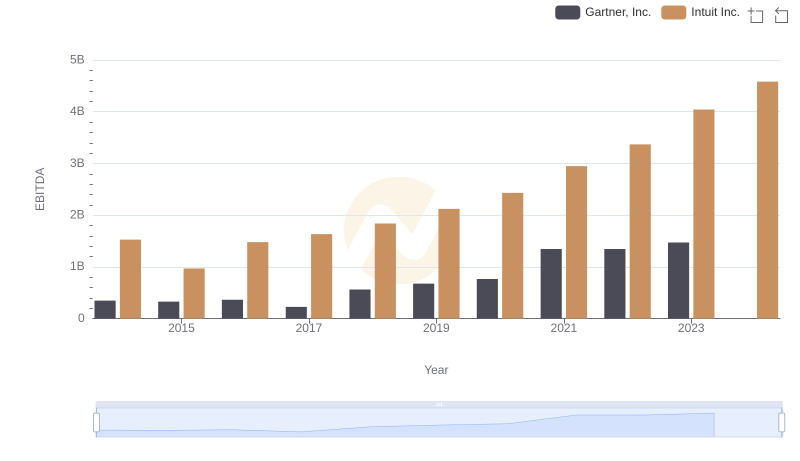
A Professional Review of EBITDA: Intuit Inc. Compared to Gartner, Inc.