| __timestamp | Dell Technologies Inc. | Intuit Inc. |
|---|---|---|
| Wednesday, January 1, 2014 | 9485000000 | 3838000000 |
| Thursday, January 1, 2015 | 8896000000 | 3467000000 |
| Friday, January 1, 2016 | 8387000000 | 3942000000 |
| Sunday, January 1, 2017 | 13649000000 | 4368000000 |
| Monday, January 1, 2018 | 20537000000 | 4987000000 |
| Tuesday, January 1, 2019 | 25053000000 | 5617000000 |
| Wednesday, January 1, 2020 | 20639000000 | 6301000000 |
| Friday, January 1, 2021 | 20140000000 | 7950000000 |
| Saturday, January 1, 2022 | 21891000000 | 10320000000 |
| Sunday, January 1, 2023 | 22686000000 | 11225000000 |
| Monday, January 1, 2024 | 20869000000 | 12820000000 |
Cracking the code
In the ever-evolving landscape of technology, Intuit Inc. and Dell Technologies Inc. have demonstrated remarkable financial trajectories over the past decade. From 2014 to 2024, Dell Technologies has consistently outperformed Intuit in terms of gross profit, with a peak in 2019 reaching approximately 25% higher than its 2014 figures. Meanwhile, Intuit has shown a steady upward trend, culminating in a 233% increase in gross profit by 2024 compared to its 2014 baseline.
This analysis underscores the dynamic growth and resilience of these tech giants, reflecting broader industry trends and strategic business maneuvers.
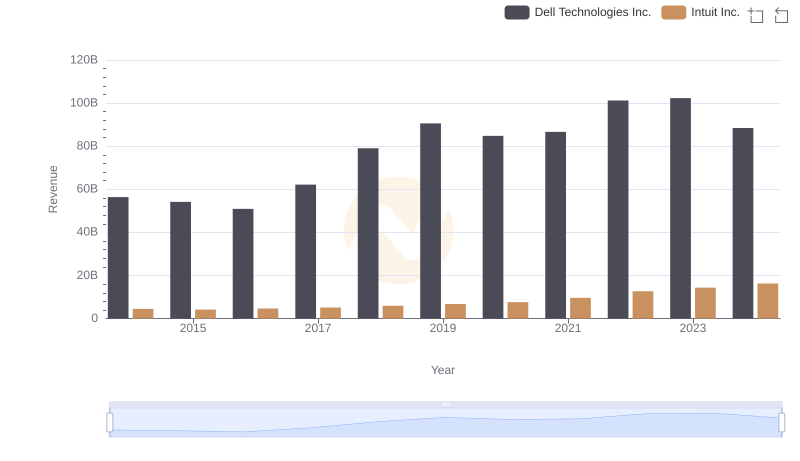
Intuit Inc. or Dell Technologies Inc.: Who Leads in Yearly Revenue?
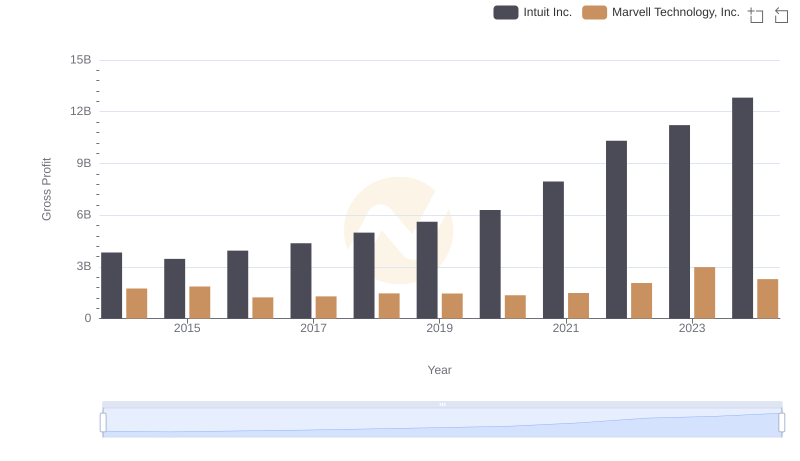
Gross Profit Analysis: Comparing Intuit Inc. and Marvell Technology, Inc.
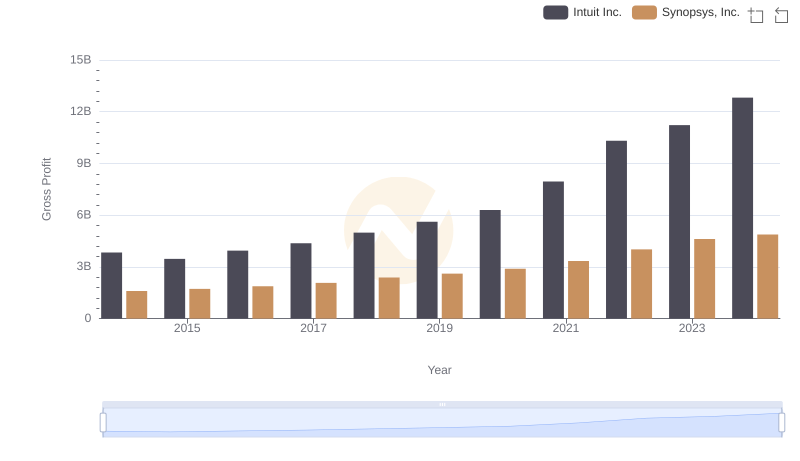
Intuit Inc. and Synopsys, Inc.: A Detailed Gross Profit Analysis
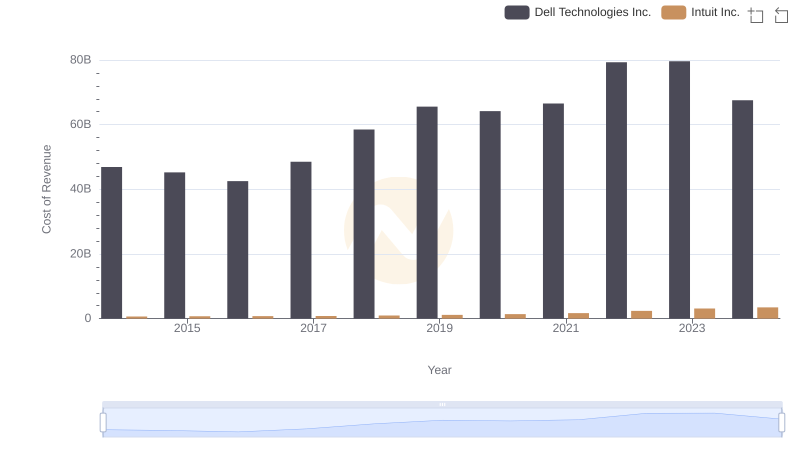
Cost of Revenue: Key Insights for Intuit Inc. and Dell Technologies Inc.
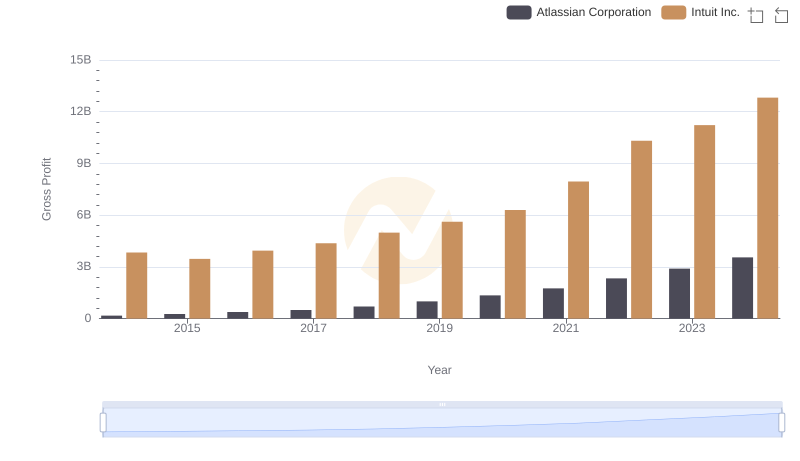
Gross Profit Analysis: Comparing Intuit Inc. and Atlassian Corporation
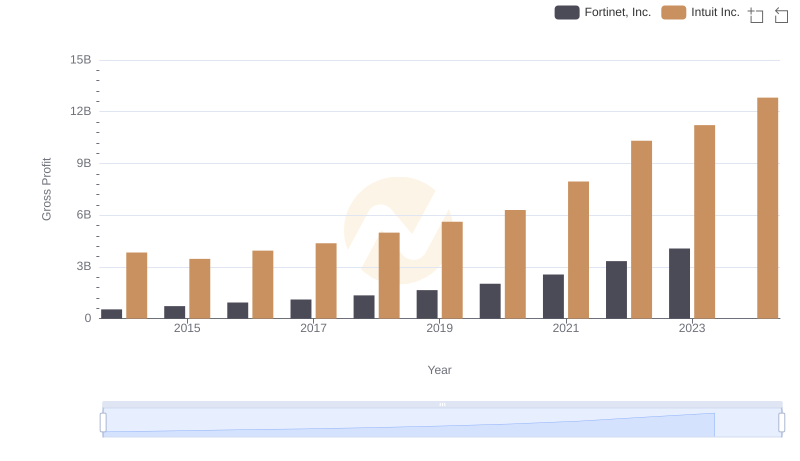
Intuit Inc. vs Fortinet, Inc.: A Gross Profit Performance Breakdown
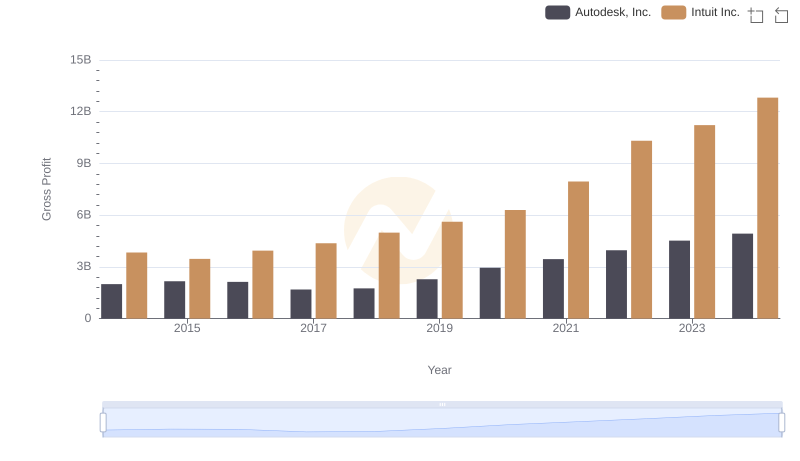
Key Insights on Gross Profit: Intuit Inc. vs Autodesk, Inc.
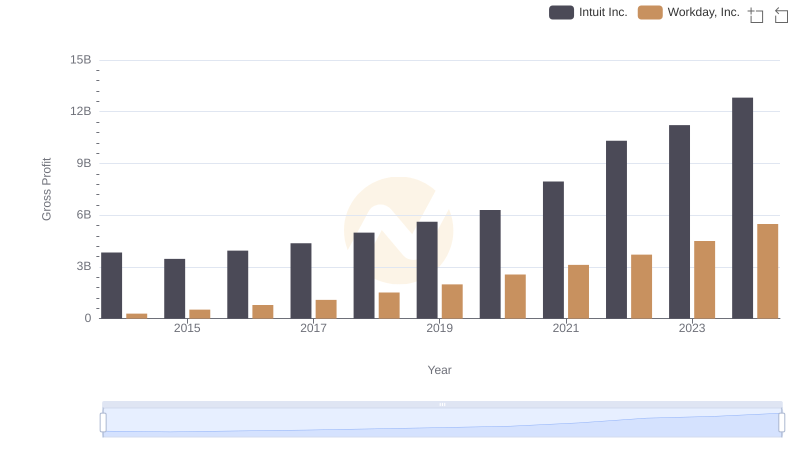
Gross Profit Comparison: Intuit Inc. and Workday, Inc. Trends
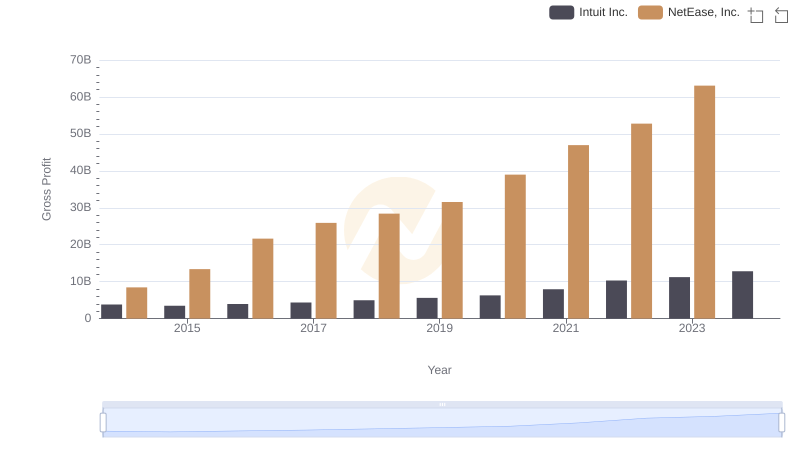
Who Generates Higher Gross Profit? Intuit Inc. or NetEase, Inc.
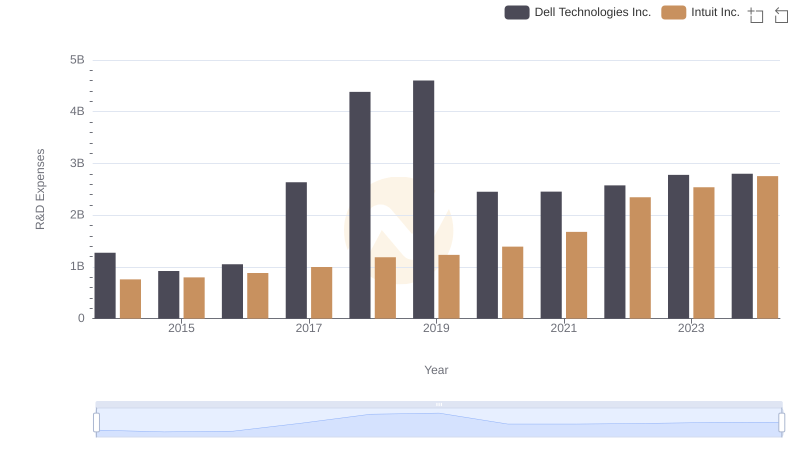
Intuit Inc. vs Dell Technologies Inc.: Strategic Focus on R&D Spending
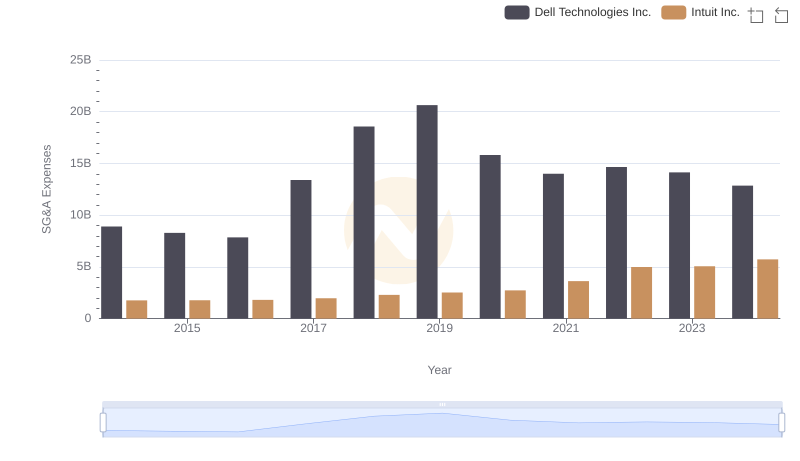
Operational Costs Compared: SG&A Analysis of Intuit Inc. and Dell Technologies Inc.
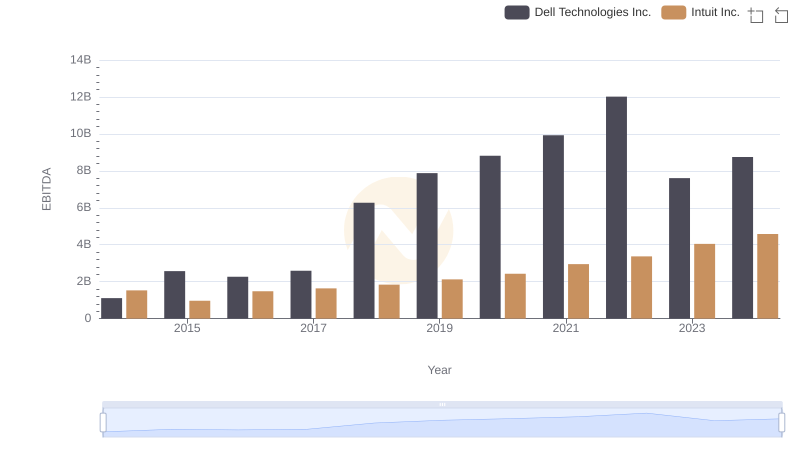
Intuit Inc. vs Dell Technologies Inc.: In-Depth EBITDA Performance Comparison