| __timestamp | Dell Technologies Inc. | Intuit Inc. |
|---|---|---|
| Wednesday, January 1, 2014 | 8906000000 | 1762000000 |
| Thursday, January 1, 2015 | 8292000000 | 1771000000 |
| Friday, January 1, 2016 | 7850000000 | 1807000000 |
| Sunday, January 1, 2017 | 13403000000 | 1973000000 |
| Monday, January 1, 2018 | 18569000000 | 2298000000 |
| Tuesday, January 1, 2019 | 20640000000 | 2524000000 |
| Wednesday, January 1, 2020 | 15819000000 | 2727000000 |
| Friday, January 1, 2021 | 14000000000 | 3626000000 |
| Saturday, January 1, 2022 | 14655000000 | 4986000000 |
| Sunday, January 1, 2023 | 14136000000 | 5062000000 |
| Monday, January 1, 2024 | 12857000000 | 5730000000 |
Infusing magic into the data realm
In the ever-evolving landscape of technology giants, operational efficiency is paramount. Over the past decade, Intuit Inc. and Dell Technologies Inc. have showcased contrasting strategies in managing their Selling, General, and Administrative (SG&A) expenses. From 2014 to 2024, Dell's SG&A expenses have fluctuated, peaking in 2019 with a 20% increase from 2014, before gradually declining. In contrast, Intuit's SG&A expenses have consistently risen, marking a 225% increase by 2024. This divergence highlights Dell's focus on cost optimization, while Intuit invests heavily in growth and innovation. As we navigate through 2024, these trends offer a glimpse into the strategic priorities of these industry leaders. Understanding these financial maneuvers provides valuable insights into their market positioning and future trajectories.
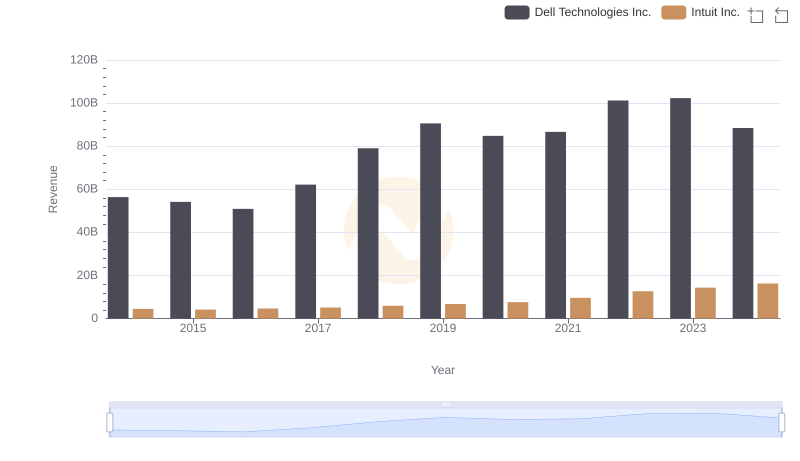
Intuit Inc. or Dell Technologies Inc.: Who Leads in Yearly Revenue?
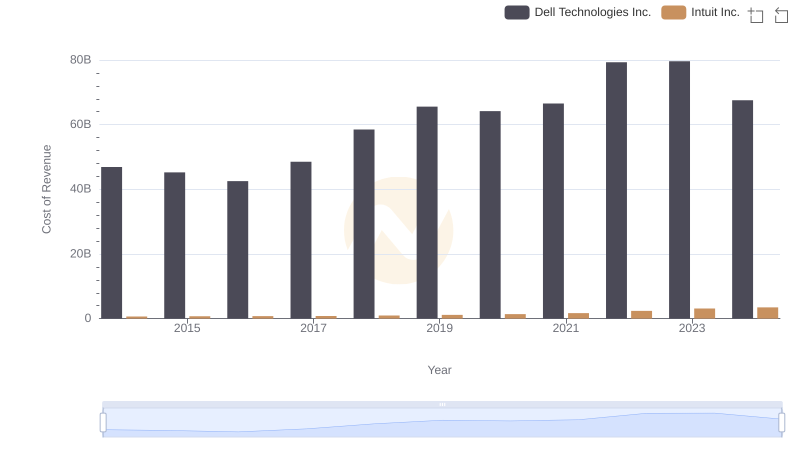
Cost of Revenue: Key Insights for Intuit Inc. and Dell Technologies Inc.
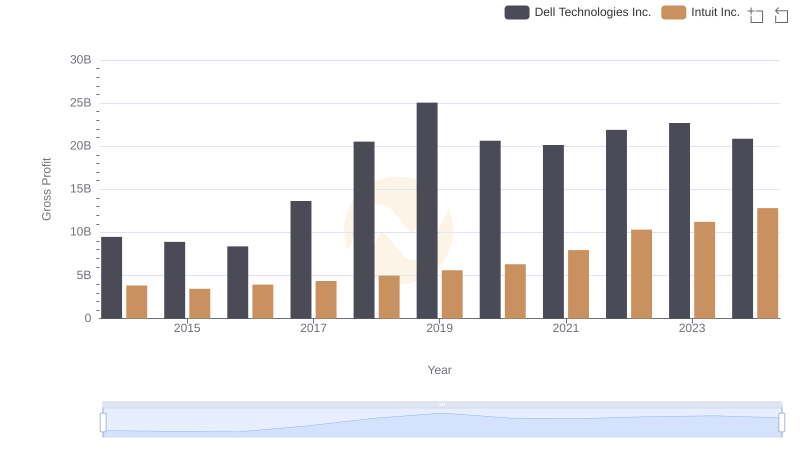
Intuit Inc. and Dell Technologies Inc.: A Detailed Gross Profit Analysis
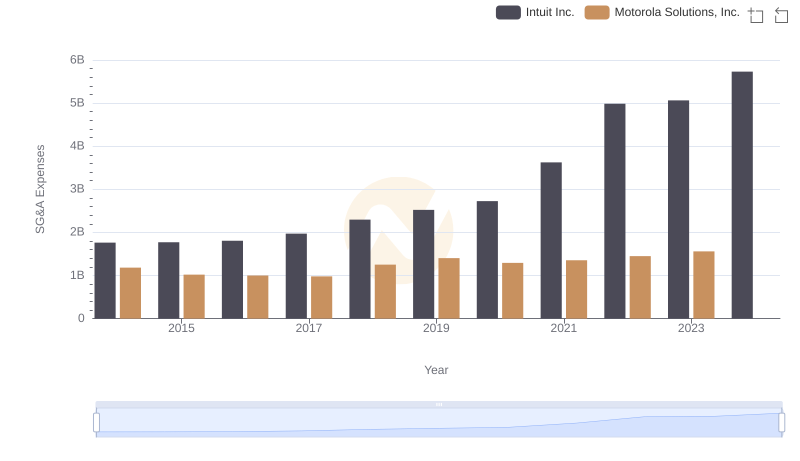
Selling, General, and Administrative Costs: Intuit Inc. vs Motorola Solutions, Inc.
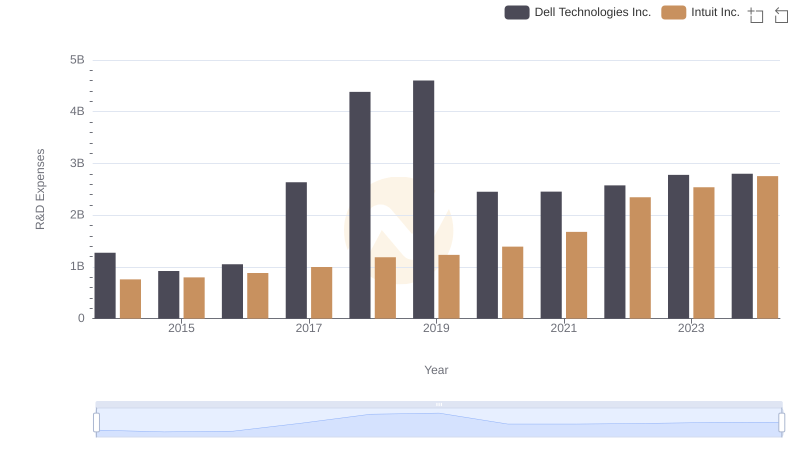
Intuit Inc. vs Dell Technologies Inc.: Strategic Focus on R&D Spending
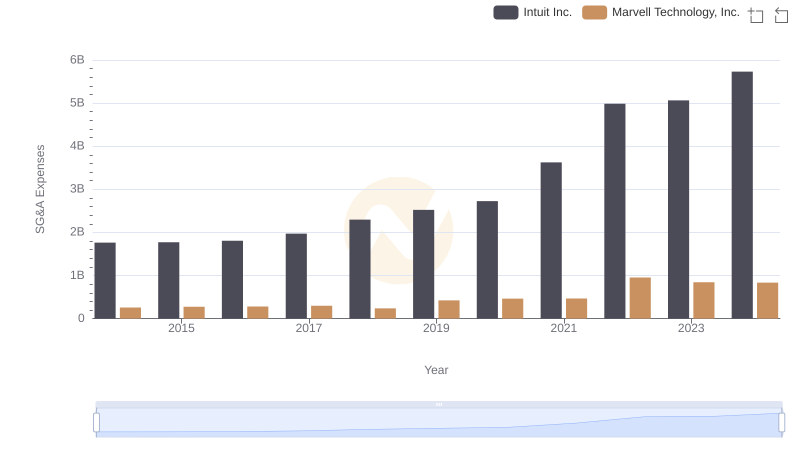
Operational Costs Compared: SG&A Analysis of Intuit Inc. and Marvell Technology, Inc.
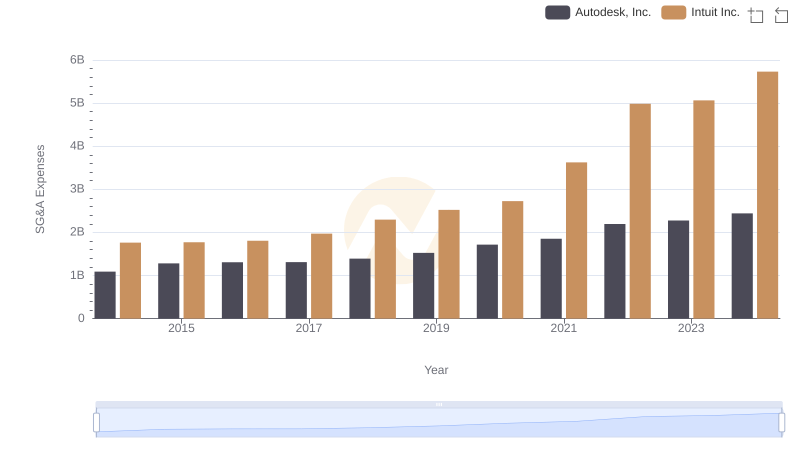
Intuit Inc. vs Autodesk, Inc.: SG&A Expense Trends
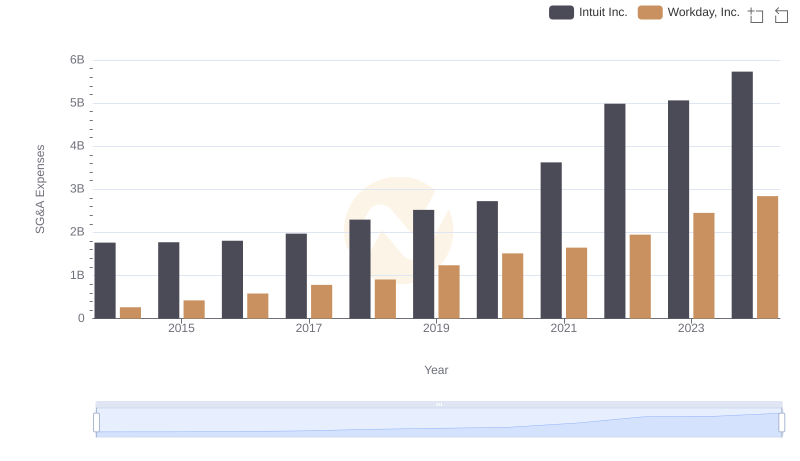
Intuit Inc. and Workday, Inc.: SG&A Spending Patterns Compared
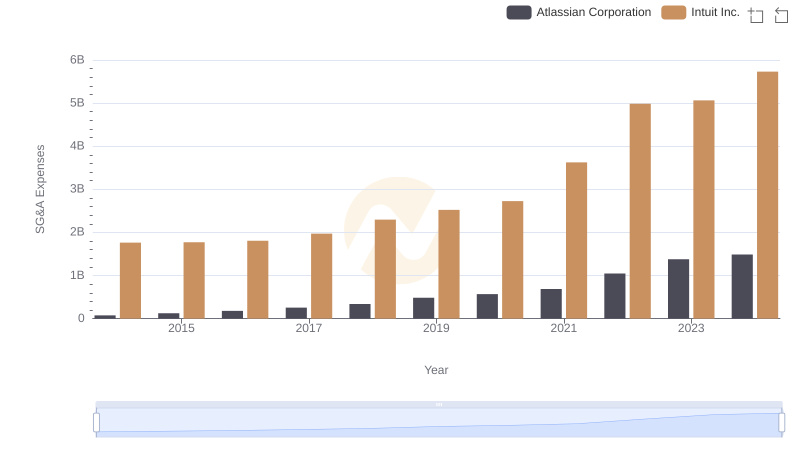
Who Optimizes SG&A Costs Better? Intuit Inc. or Atlassian Corporation
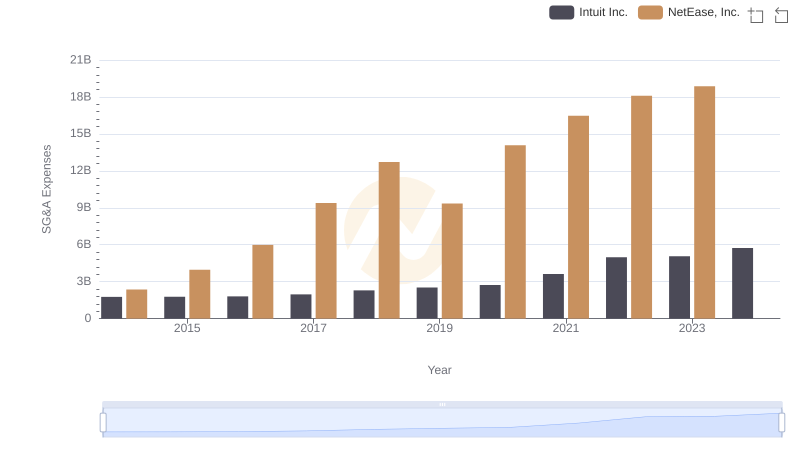
Breaking Down SG&A Expenses: Intuit Inc. vs NetEase, Inc.
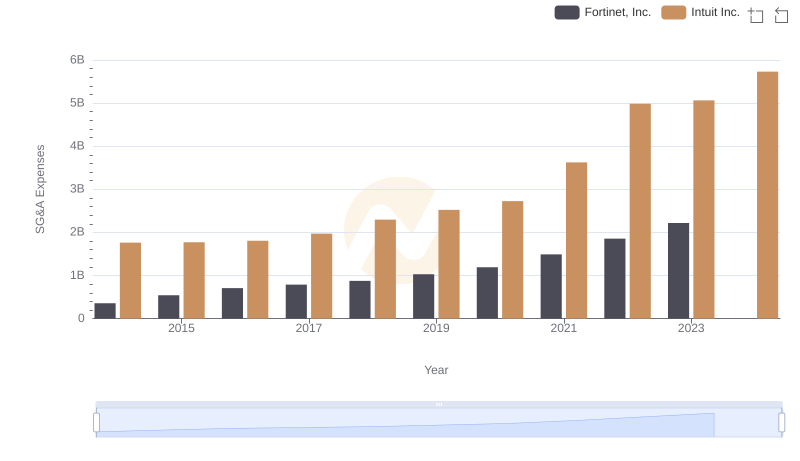
SG&A Efficiency Analysis: Comparing Intuit Inc. and Fortinet, Inc.
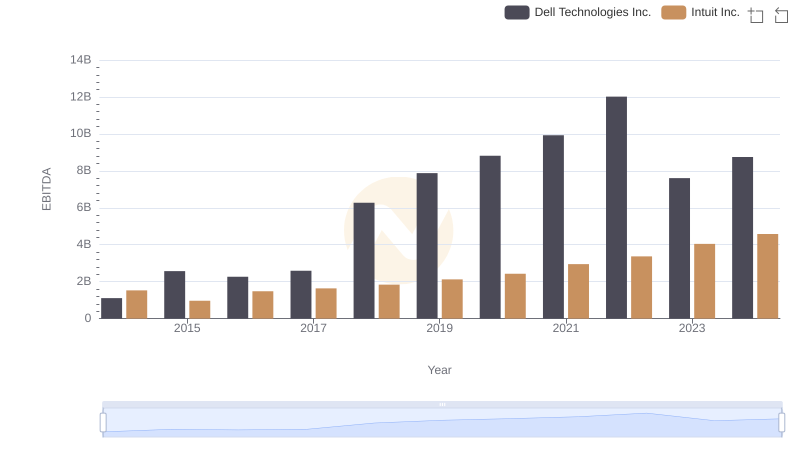
Intuit Inc. vs Dell Technologies Inc.: In-Depth EBITDA Performance Comparison