| __timestamp | Intuit Inc. | Leidos Holdings, Inc. |
|---|---|---|
| Wednesday, January 1, 2014 | 1762000000 | 310000000 |
| Thursday, January 1, 2015 | 1771000000 | 232000000 |
| Friday, January 1, 2016 | 1807000000 | 334000000 |
| Sunday, January 1, 2017 | 1973000000 | 552000000 |
| Monday, January 1, 2018 | 2298000000 | 729000000 |
| Tuesday, January 1, 2019 | 2524000000 | 689000000 |
| Wednesday, January 1, 2020 | 2727000000 | 770000000 |
| Friday, January 1, 2021 | 3626000000 | 860000000 |
| Saturday, January 1, 2022 | 4986000000 | 950000000 |
| Sunday, January 1, 2023 | 5062000000 | 942000000 |
| Monday, January 1, 2024 | 5730000000 | 983000000 |
In pursuit of knowledge
In the ever-evolving landscape of corporate finance, understanding operational costs is crucial. Over the past decade, Intuit Inc. and Leidos Holdings, Inc. have showcased contrasting trends in their Selling, General, and Administrative (SG&A) expenses. Intuit Inc. has seen a remarkable increase of over 225% in SG&A expenses from 2014 to 2023, reflecting its aggressive growth strategy and market expansion. In contrast, Leidos Holdings, Inc. experienced a more modest rise of approximately 200% over the same period, indicating a steady yet cautious approach.
The data reveals that Intuit's SG&A expenses surged significantly post-2020, peaking in 2024, while Leidos maintained a consistent trajectory. This divergence highlights differing corporate strategies and market responses. Notably, data for Leidos in 2024 is unavailable, suggesting potential shifts or reporting changes. As businesses navigate the complexities of the modern economy, these insights offer a window into strategic financial management.
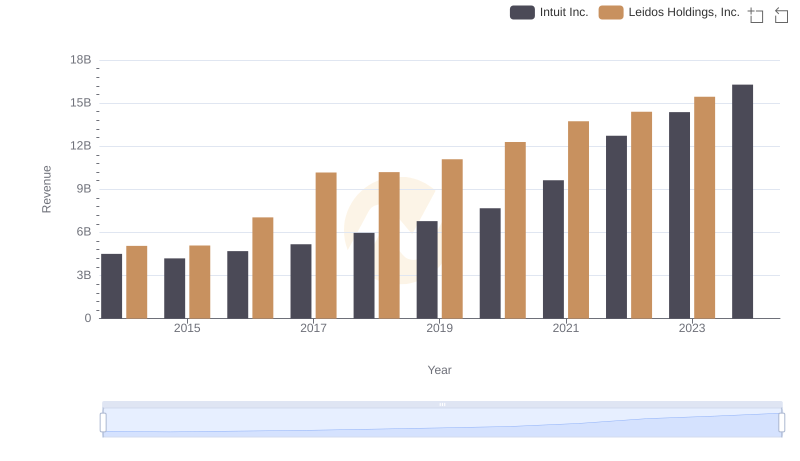
Intuit Inc. vs Leidos Holdings, Inc.: Examining Key Revenue Metrics
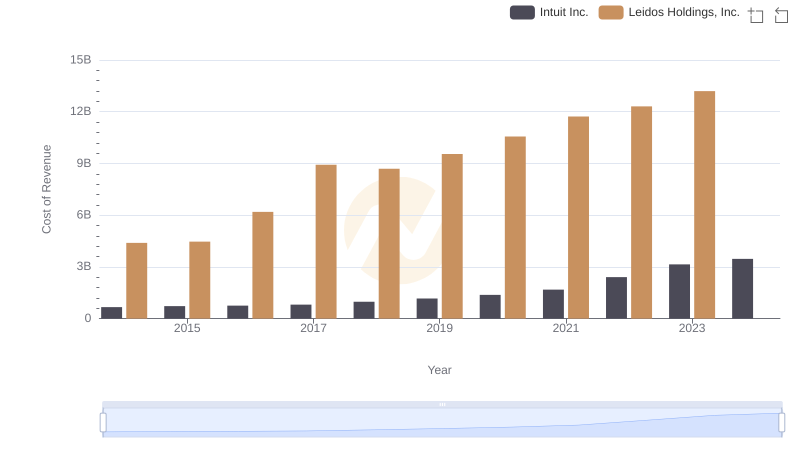
Intuit Inc. vs Leidos Holdings, Inc.: Efficiency in Cost of Revenue Explored
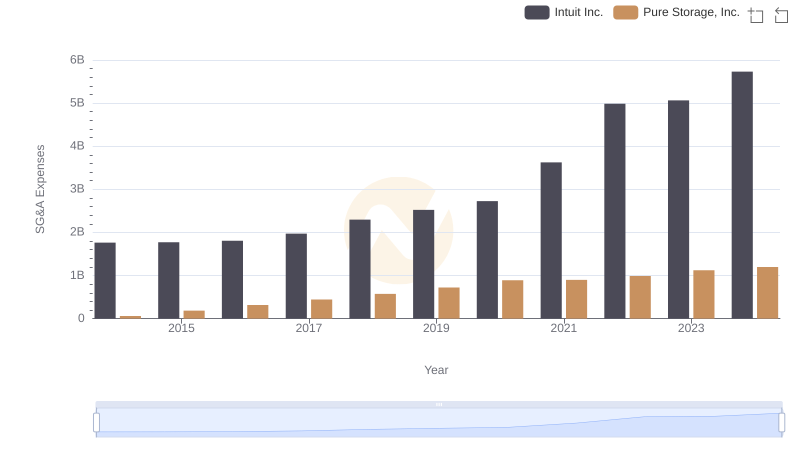
Comparing SG&A Expenses: Intuit Inc. vs Pure Storage, Inc. Trends and Insights
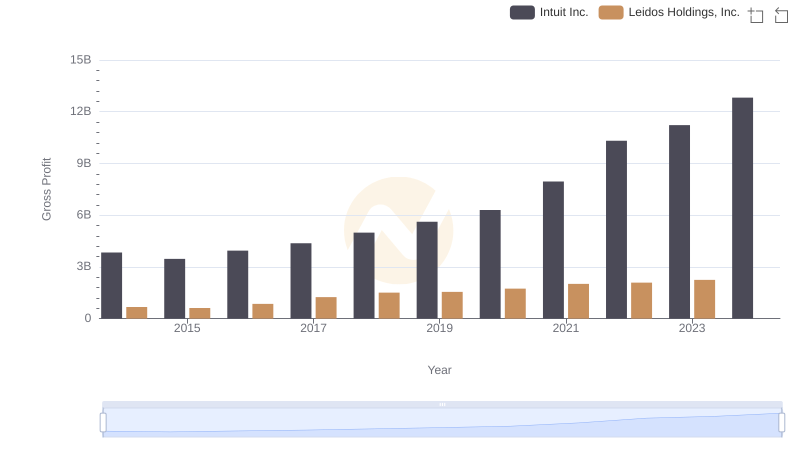
Intuit Inc. and Leidos Holdings, Inc.: A Detailed Gross Profit Analysis
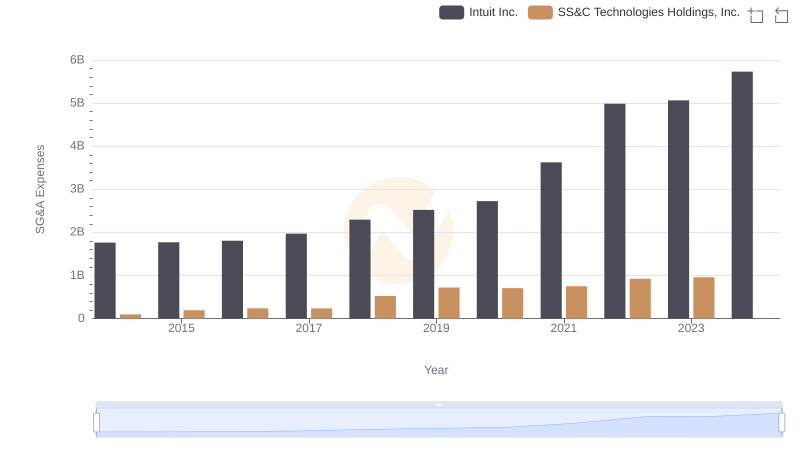
Cost Management Insights: SG&A Expenses for Intuit Inc. and SS&C Technologies Holdings, Inc.

Intuit Inc. and Teradyne, Inc.: SG&A Spending Patterns Compared
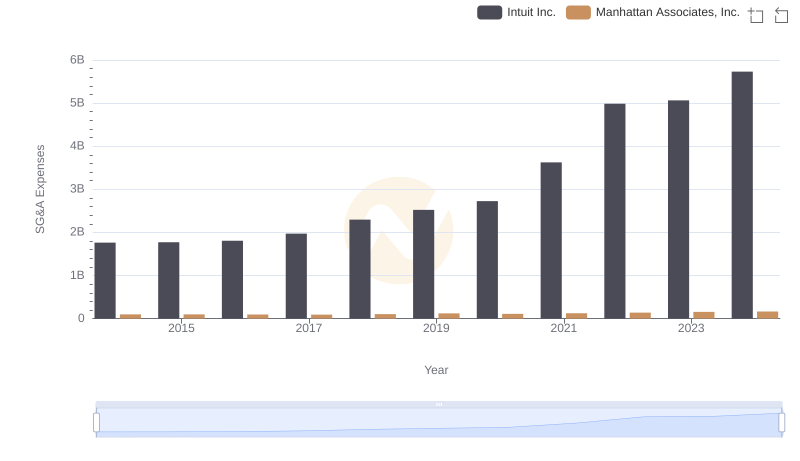
Intuit Inc. vs Manhattan Associates, Inc.: SG&A Expense Trends
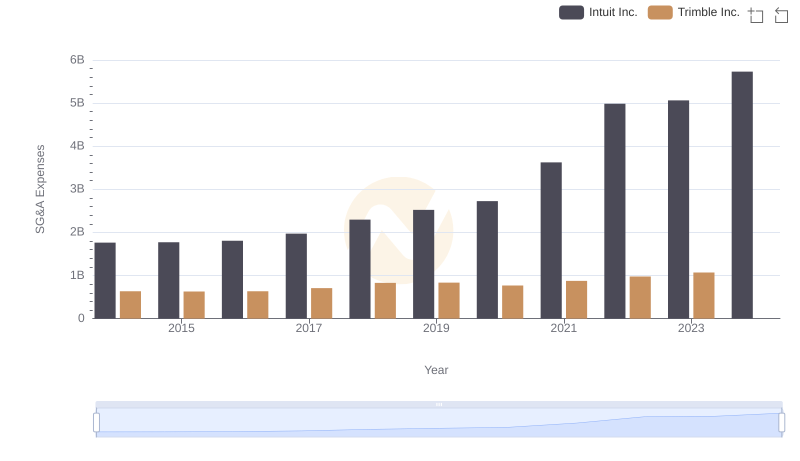
Intuit Inc. or Trimble Inc.: Who Manages SG&A Costs Better?
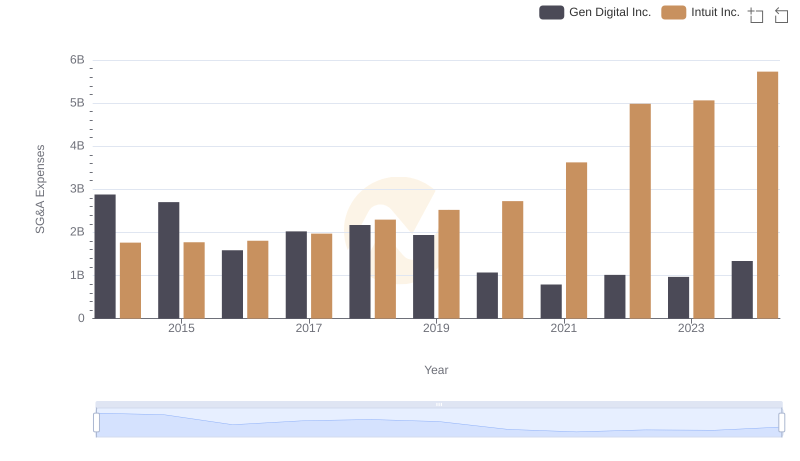
Breaking Down SG&A Expenses: Intuit Inc. vs Gen Digital Inc.
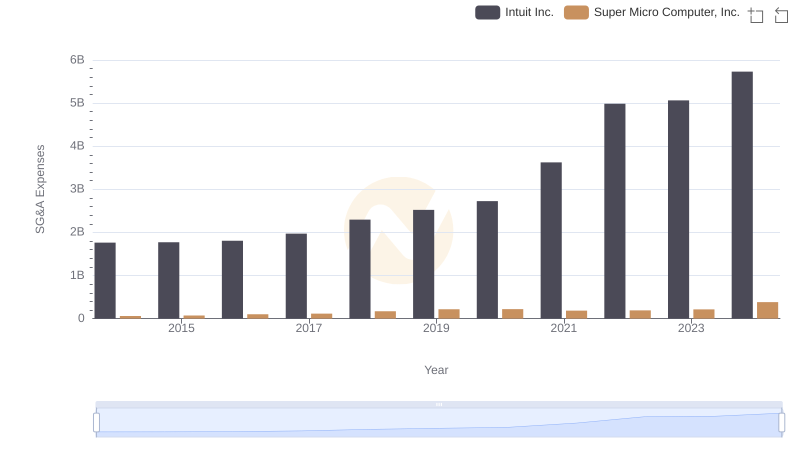
Operational Costs Compared: SG&A Analysis of Intuit Inc. and Super Micro Computer, Inc.
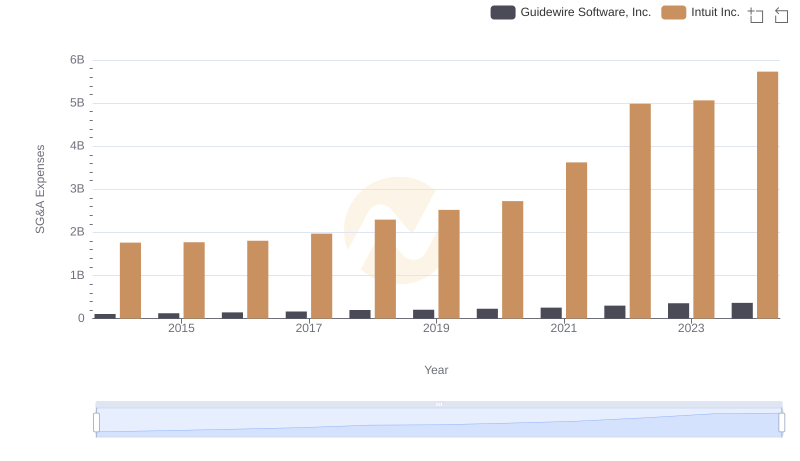
Selling, General, and Administrative Costs: Intuit Inc. vs Guidewire Software, Inc.
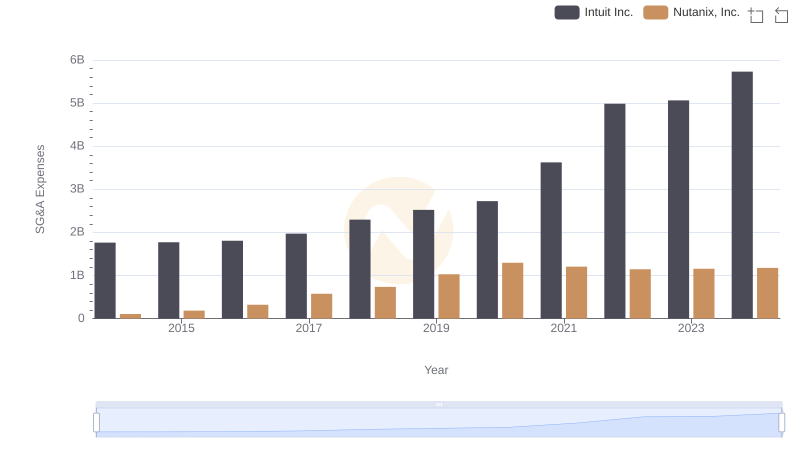
Who Optimizes SG&A Costs Better? Intuit Inc. or Nutanix, Inc.