| __timestamp | Infosys Limited | Intuit Inc. |
|---|---|---|
| Wednesday, January 1, 2014 | 2258000000 | 1528000000 |
| Thursday, January 1, 2015 | 2590000000 | 970000000 |
| Friday, January 1, 2016 | 2765000000 | 1480000000 |
| Sunday, January 1, 2017 | 2936000000 | 1634000000 |
| Monday, January 1, 2018 | 2984000000 | 1839000000 |
| Tuesday, January 1, 2019 | 3053000000 | 2121000000 |
| Wednesday, January 1, 2020 | 4053342784 | 2430000000 |
| Friday, January 1, 2021 | 4116000000 | 2948000000 |
| Saturday, January 1, 2022 | 4707334610 | 3369000000 |
| Sunday, January 1, 2023 | 4206000000 | 4043000000 |
| Monday, January 1, 2024 | 4581000000 |
Unveiling the hidden dimensions of data
In the ever-evolving landscape of global technology, Intuit Inc. and Infosys Limited stand as titans of innovation and financial prowess. Over the past decade, these companies have demonstrated remarkable EBITDA growth, a key indicator of operational efficiency. From 2014 to 2023, Infosys Limited's EBITDA surged by approximately 86%, peaking in 2022, while Intuit Inc. showcased a robust 165% increase, reaching its zenith in 2024. Notably, Intuit's EBITDA surpassed Infosys in 2023, marking a pivotal shift in financial dynamics. This trend underscores Intuit's strategic advancements and market adaptability. However, the absence of Infosys data for 2024 leaves room for speculation on its future trajectory. As these industry leaders continue to innovate, their financial performances offer valuable insights into the competitive tech sector.
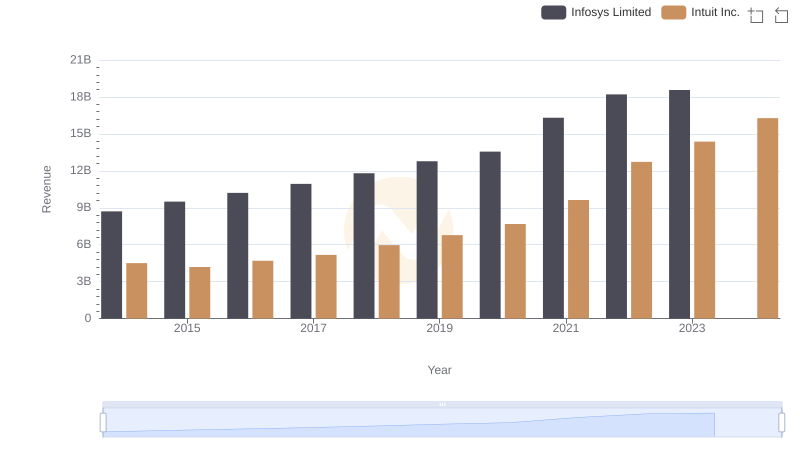
Revenue Showdown: Intuit Inc. vs Infosys Limited
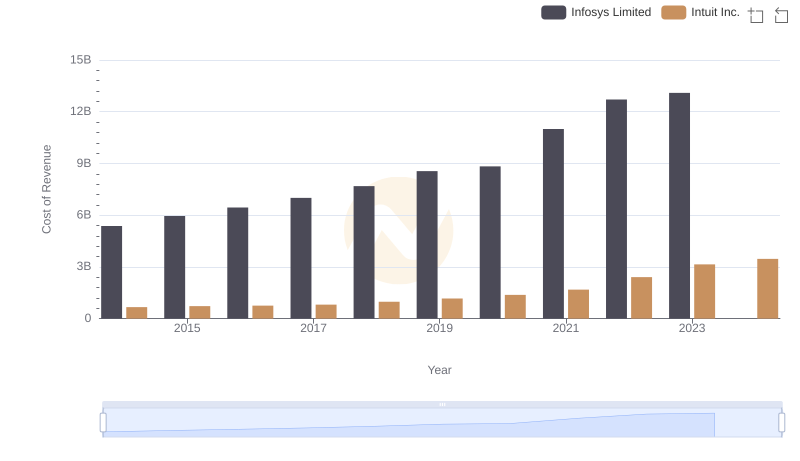
Comparing Cost of Revenue Efficiency: Intuit Inc. vs Infosys Limited
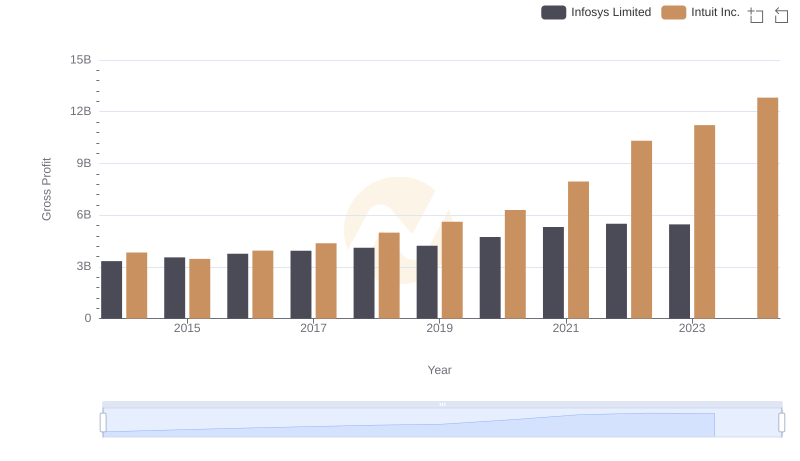
Gross Profit Trends Compared: Intuit Inc. vs Infosys Limited
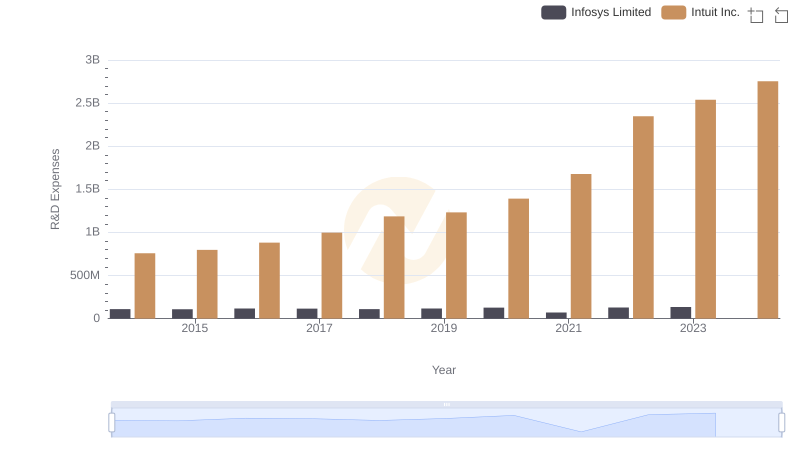
Research and Development Investment: Intuit Inc. vs Infosys Limited
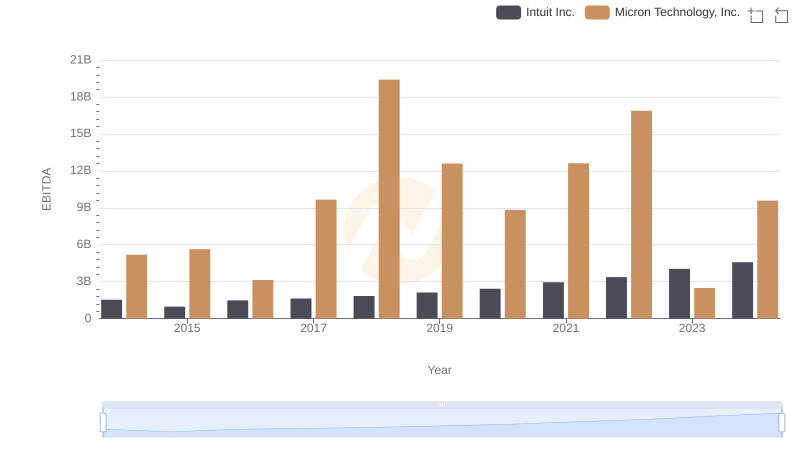
A Side-by-Side Analysis of EBITDA: Intuit Inc. and Micron Technology, Inc.
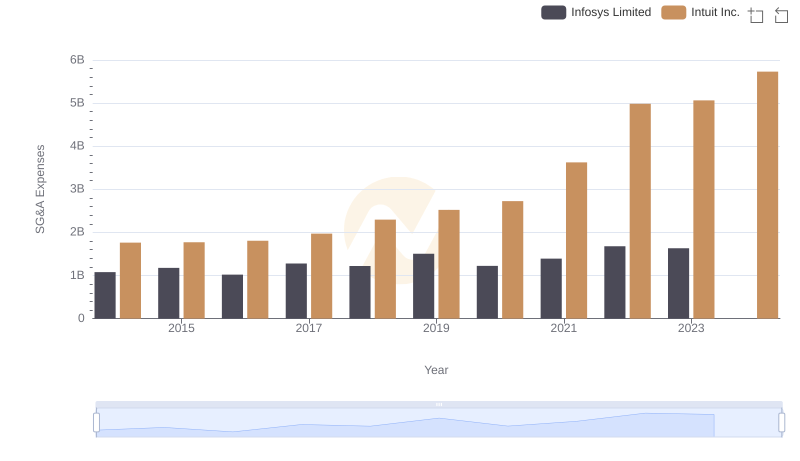
Intuit Inc. and Infosys Limited: SG&A Spending Patterns Compared
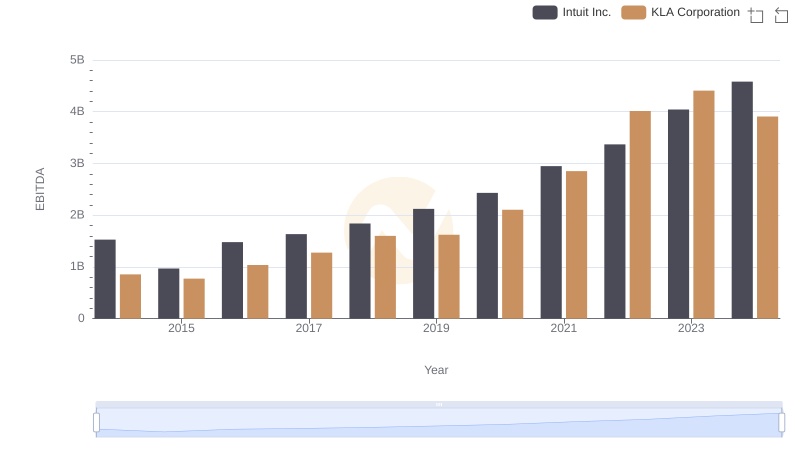
Intuit Inc. vs KLA Corporation: In-Depth EBITDA Performance Comparison
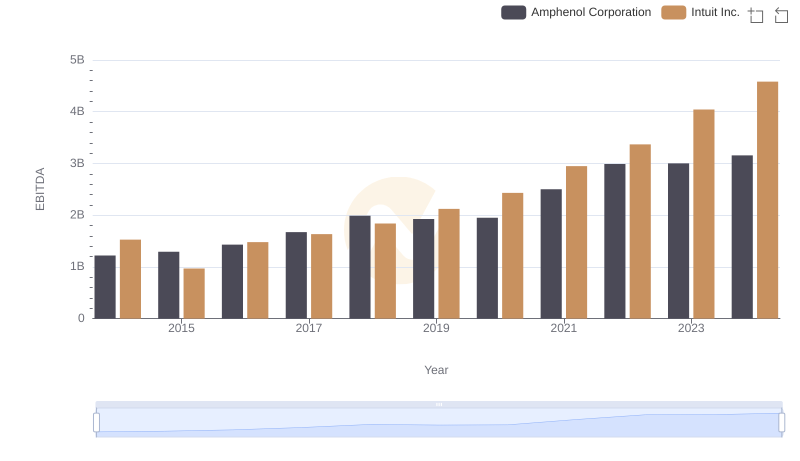
A Side-by-Side Analysis of EBITDA: Intuit Inc. and Amphenol Corporation
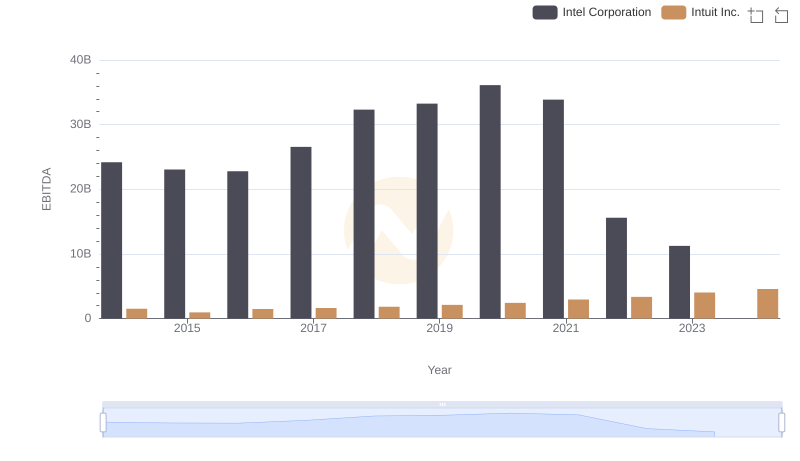
A Professional Review of EBITDA: Intuit Inc. Compared to Intel Corporation
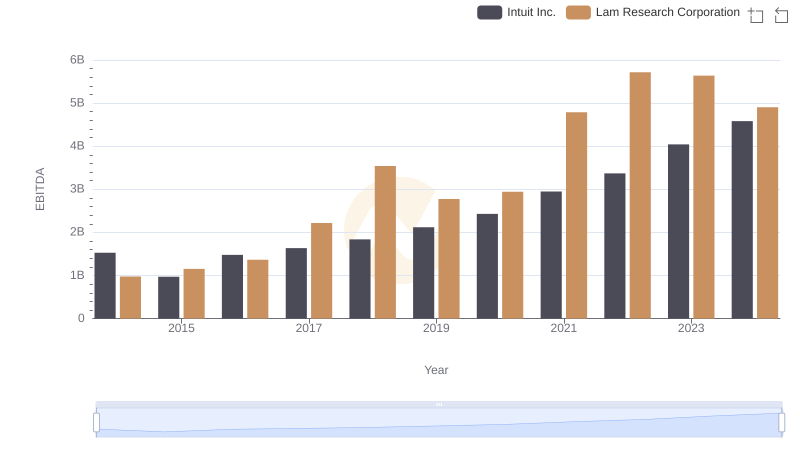
Intuit Inc. and Lam Research Corporation: A Detailed Examination of EBITDA Performance
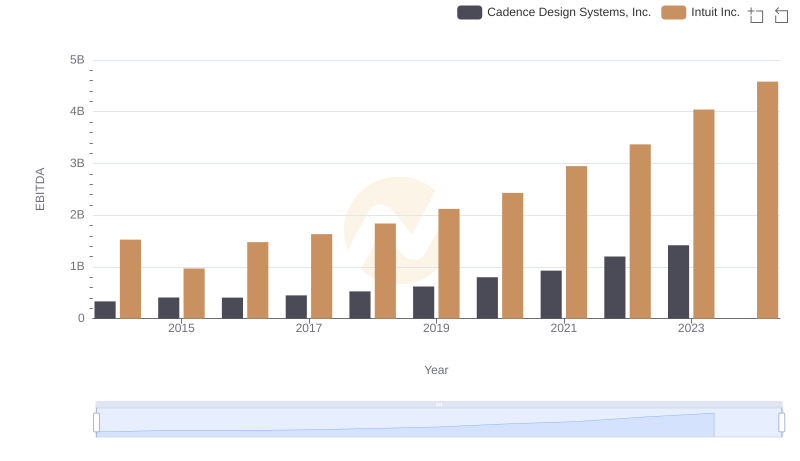
Comparative EBITDA Analysis: Intuit Inc. vs Cadence Design Systems, Inc.
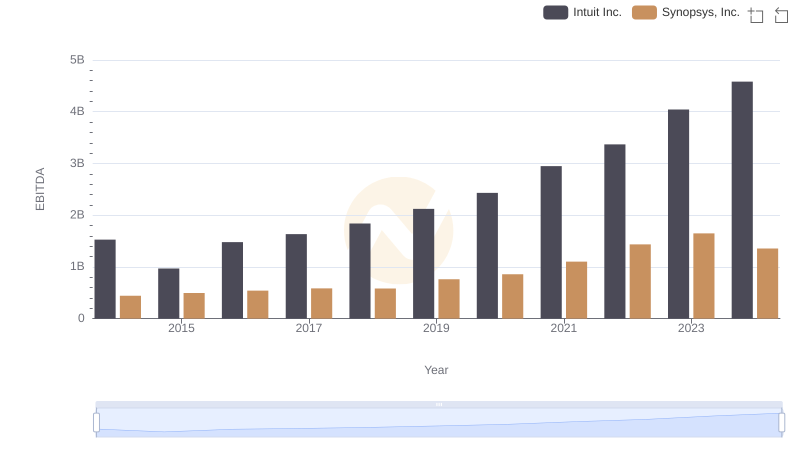
EBITDA Analysis: Evaluating Intuit Inc. Against Synopsys, Inc.