| __timestamp | International Business Machines Corporation | Synopsys, Inc. |
|---|---|---|
| Wednesday, January 1, 2014 | 46407000000 | 1600587000 |
| Thursday, January 1, 2015 | 40684000000 | 1723291000 |
| Friday, January 1, 2016 | 38516000000 | 1879570000 |
| Sunday, January 1, 2017 | 36943000000 | 2070696000 |
| Monday, January 1, 2018 | 36936000000 | 2385160000 |
| Tuesday, January 1, 2019 | 31533000000 | 2607748000 |
| Wednesday, January 1, 2020 | 30865000000 | 2890591000 |
| Friday, January 1, 2021 | 31486000000 | 3342416000 |
| Saturday, January 1, 2022 | 32687000000 | 4017845000 |
| Sunday, January 1, 2023 | 34300000000 | 4620426000 |
| Monday, January 1, 2024 | 35551000000 | 4882147000 |
Unlocking the unknown
In the ever-evolving landscape of technology, International Business Machines Corporation (IBM) and Synopsys, Inc. stand as titans in their respective domains. Over the past decade, IBM's gross profit has seen a decline of approximately 26%, from a peak in 2014 to a more modest figure in 2024. This trend reflects the challenges faced by traditional tech giants in adapting to new market dynamics.
Conversely, Synopsys, a leader in electronic design automation, has experienced a remarkable growth trajectory. From 2014 to 2024, its gross profit surged by over 200%, showcasing its ability to capitalize on the increasing demand for semiconductor design solutions. This stark contrast highlights the shifting paradigms within the tech industry, where agility and innovation are key to sustained growth.
As we look to the future, the performance of these companies will continue to offer valuable insights into the broader trends shaping the technology sector.
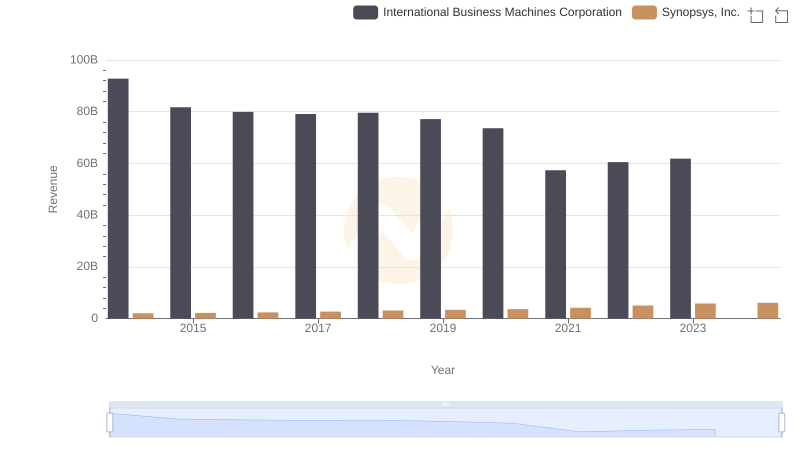
International Business Machines Corporation vs Synopsys, Inc.: Annual Revenue Growth Compared
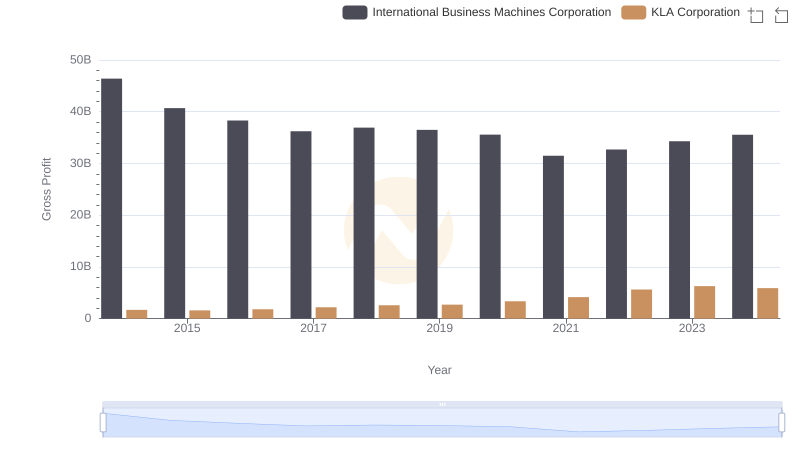
International Business Machines Corporation vs KLA Corporation: A Gross Profit Performance Breakdown
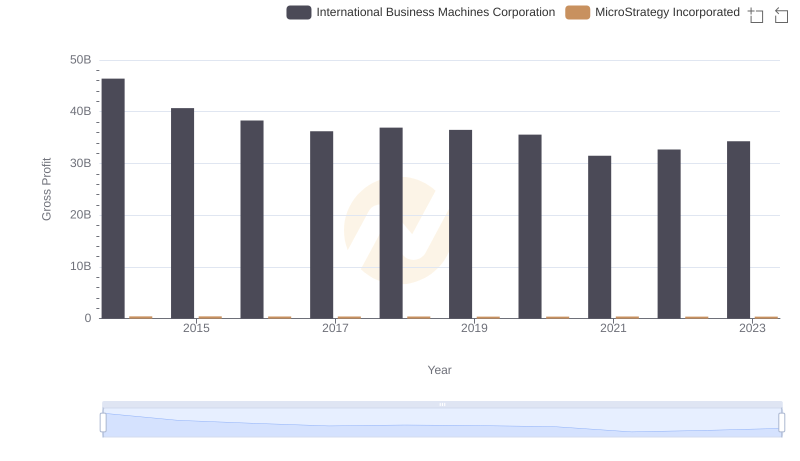
International Business Machines Corporation vs MicroStrategy Incorporated: A Gross Profit Performance Breakdown

Gross Profit Trends Compared: International Business Machines Corporation vs Marvell Technology, Inc.

Cost of Revenue Comparison: International Business Machines Corporation vs Synopsys, Inc.
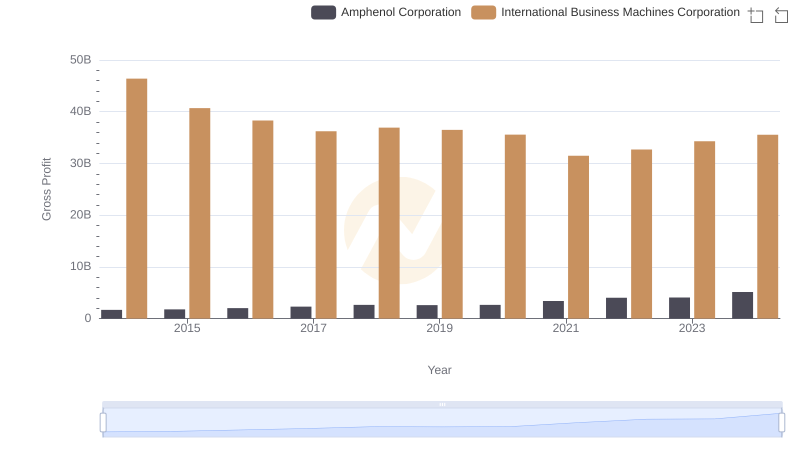
Who Generates Higher Gross Profit? International Business Machines Corporation or Amphenol Corporation
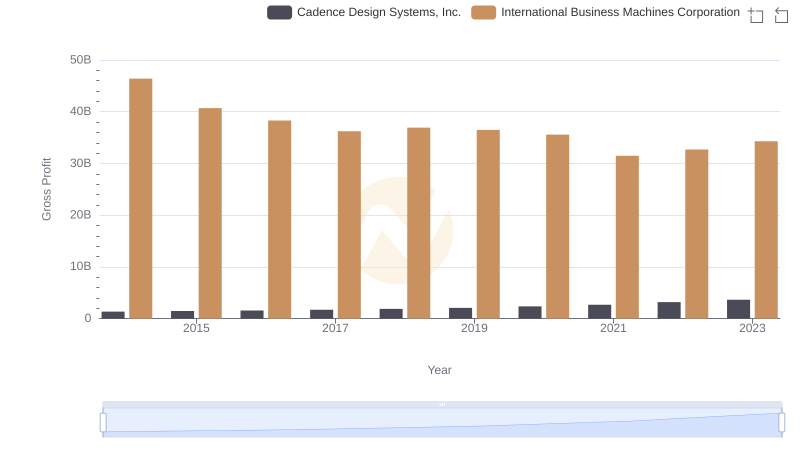
Gross Profit Analysis: Comparing International Business Machines Corporation and Cadence Design Systems, Inc.
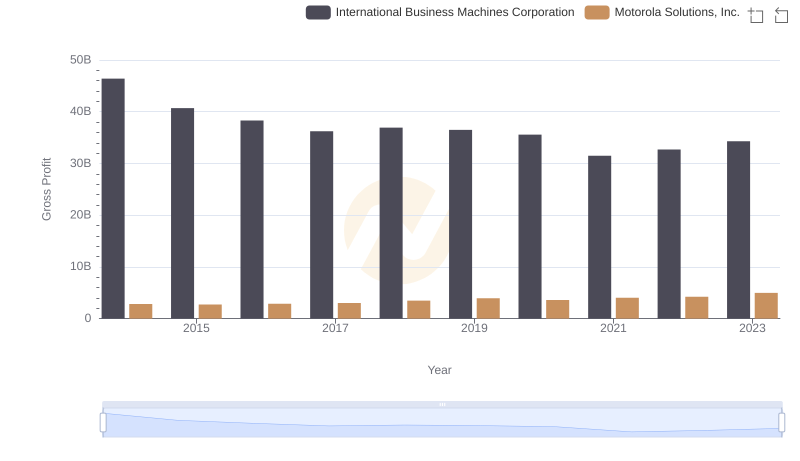
Gross Profit Trends Compared: International Business Machines Corporation vs Motorola Solutions, Inc.
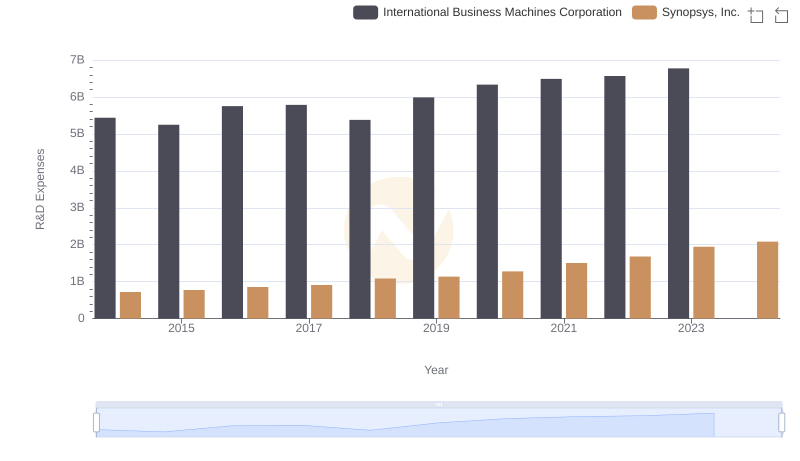
Who Prioritizes Innovation? R&D Spending Compared for International Business Machines Corporation and Synopsys, Inc.
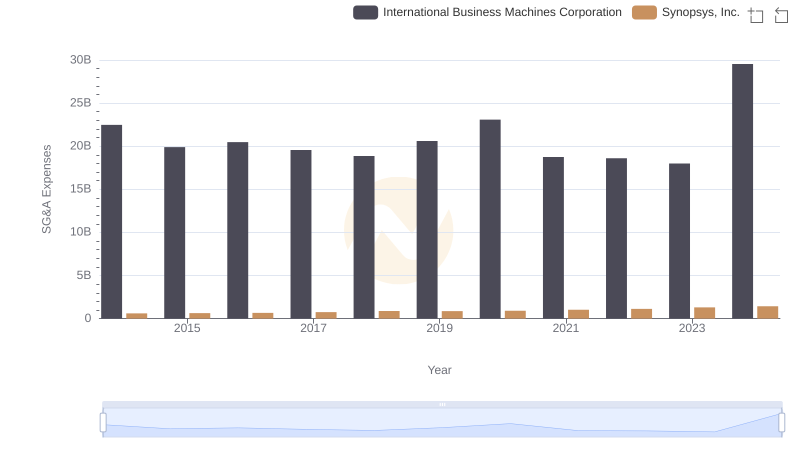
International Business Machines Corporation or Synopsys, Inc.: Who Manages SG&A Costs Better?
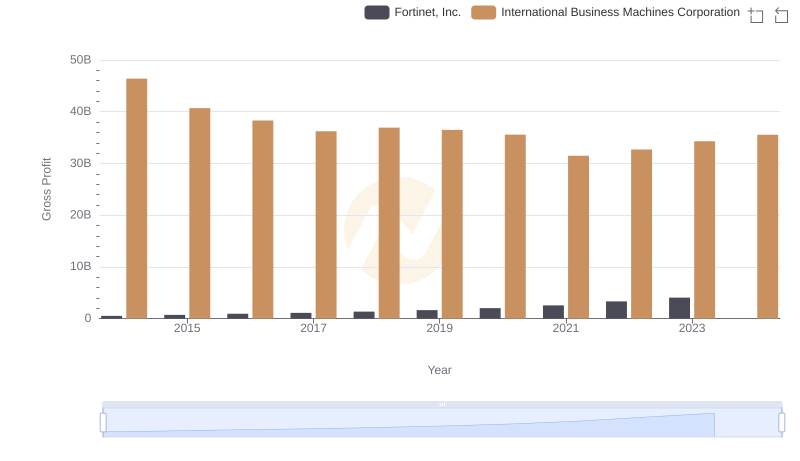
Who Generates Higher Gross Profit? International Business Machines Corporation or Fortinet, Inc.
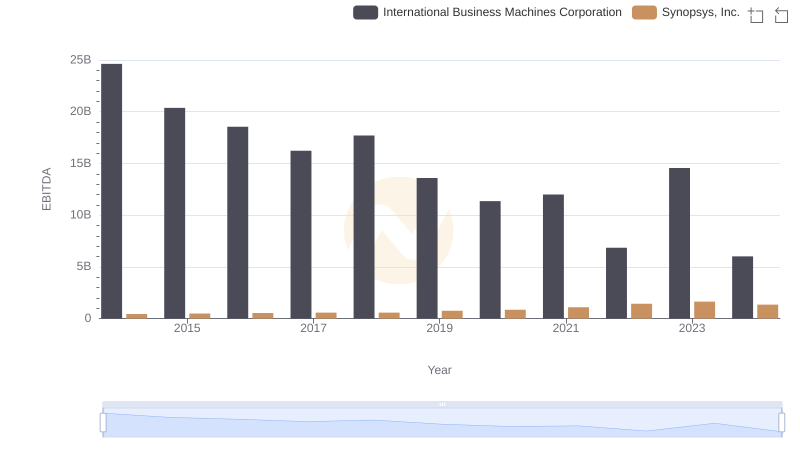
International Business Machines Corporation and Synopsys, Inc.: A Detailed Examination of EBITDA Performance