| __timestamp | International Business Machines Corporation | Synopsys, Inc. |
|---|---|---|
| Wednesday, January 1, 2014 | 46386000000 | 456885000 |
| Thursday, January 1, 2015 | 41057000000 | 518920000 |
| Friday, January 1, 2016 | 41403000000 | 542962000 |
| Sunday, January 1, 2017 | 42196000000 | 654184000 |
| Monday, January 1, 2018 | 42655000000 | 735898000 |
| Tuesday, January 1, 2019 | 26181000000 | 752946000 |
| Wednesday, January 1, 2020 | 24314000000 | 794690000 |
| Friday, January 1, 2021 | 25865000000 | 861777000 |
| Saturday, January 1, 2022 | 27842000000 | 1063697000 |
| Sunday, January 1, 2023 | 27560000000 | 1222193000 |
| Monday, January 1, 2024 | 27202000000 | 1245289000 |
Data in motion
In the ever-evolving landscape of technology, the cost of revenue is a critical metric that reflects a company's operational efficiency. From 2014 to 2024, International Business Machines Corporation (IBM) and Synopsys, Inc. have showcased contrasting trajectories in their cost of revenue. IBM, a stalwart in the tech industry, has seen its cost of revenue decrease by approximately 41% over this period, from a peak in 2014 to a more streamlined figure in 2024. This reduction highlights IBM's strategic shift towards more efficient operations and possibly a focus on higher-margin services.
Conversely, Synopsys, a leader in electronic design automation, has experienced a steady increase in its cost of revenue, growing by about 172% over the same period. This growth reflects Synopsys' expansion and increased investment in innovation to maintain its competitive edge. The data underscores the dynamic nature of the tech industry, where companies must adapt to thrive.
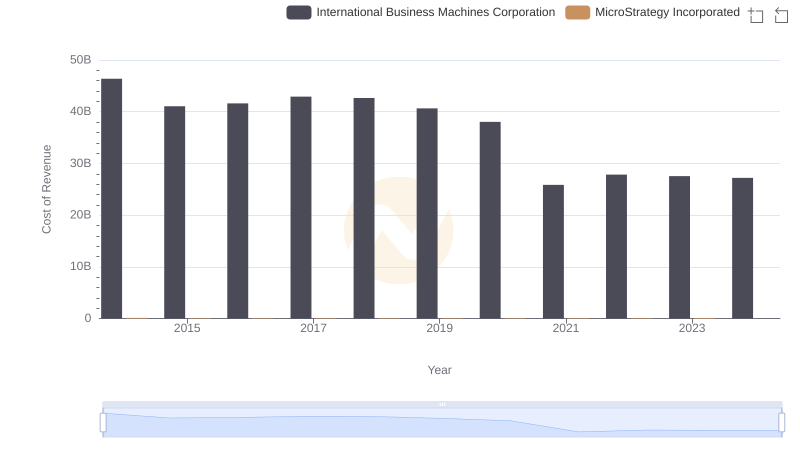
Cost of Revenue: Key Insights for International Business Machines Corporation and MicroStrategy Incorporated
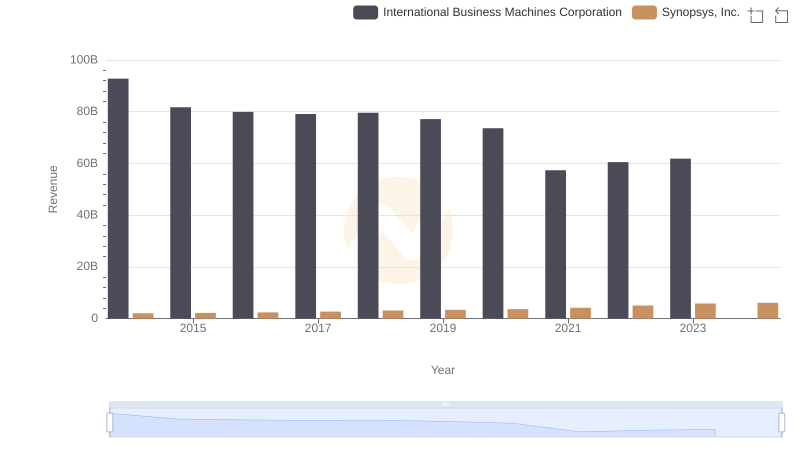
International Business Machines Corporation vs Synopsys, Inc.: Annual Revenue Growth Compared
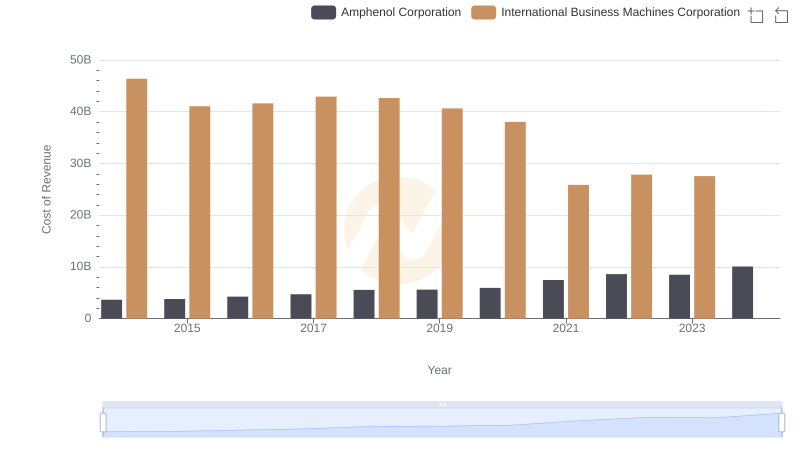
Comparing Cost of Revenue Efficiency: International Business Machines Corporation vs Amphenol Corporation
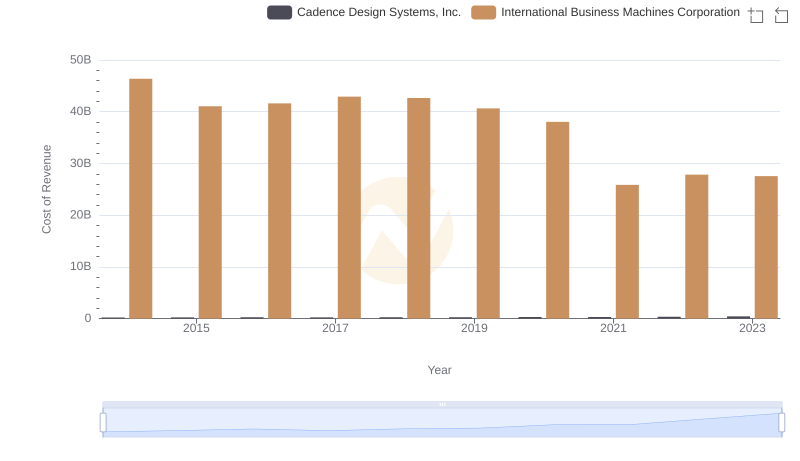
Cost of Revenue Comparison: International Business Machines Corporation vs Cadence Design Systems, Inc.
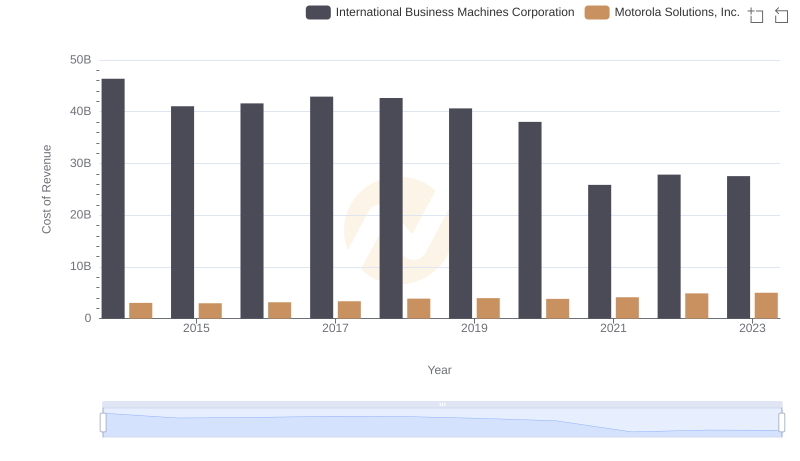
Analyzing Cost of Revenue: International Business Machines Corporation and Motorola Solutions, Inc.
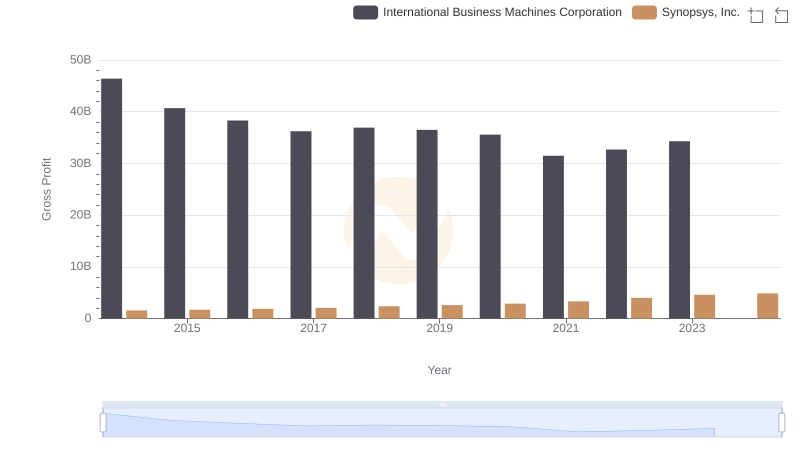
Key Insights on Gross Profit: International Business Machines Corporation vs Synopsys, Inc.
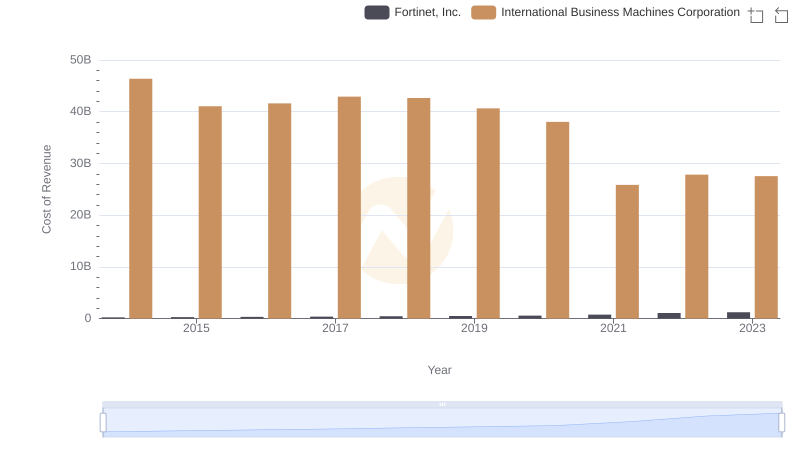
Cost Insights: Breaking Down International Business Machines Corporation and Fortinet, Inc.'s Expenses
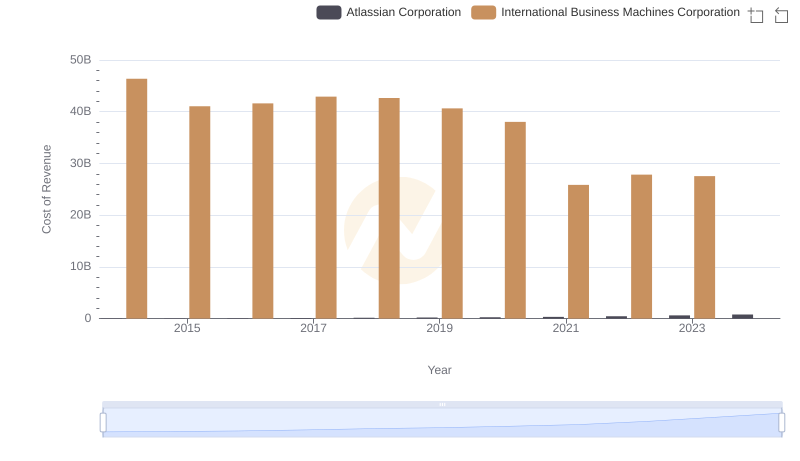
Cost of Revenue: Key Insights for International Business Machines Corporation and Atlassian Corporation
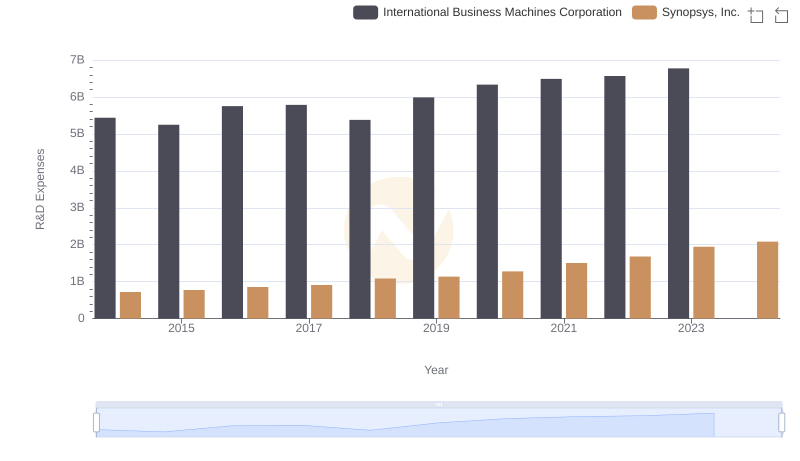
Who Prioritizes Innovation? R&D Spending Compared for International Business Machines Corporation and Synopsys, Inc.
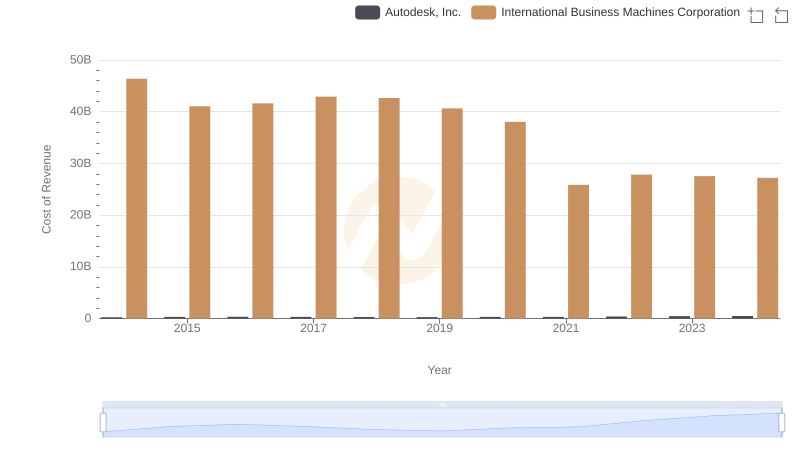
Cost of Revenue Trends: International Business Machines Corporation vs Autodesk, Inc.
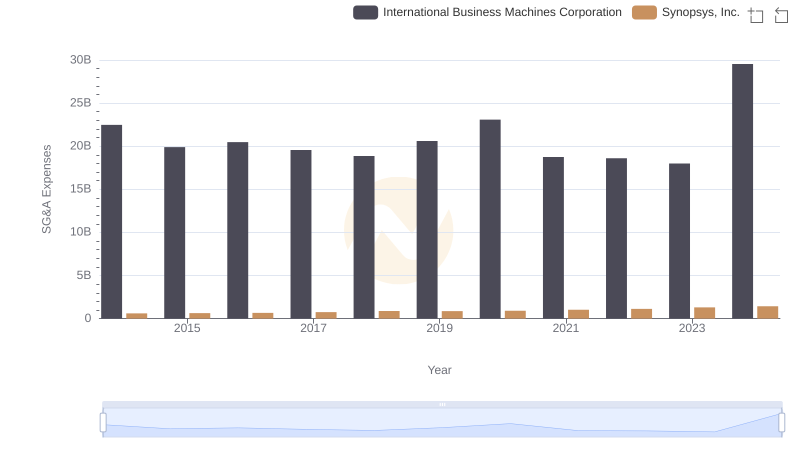
International Business Machines Corporation or Synopsys, Inc.: Who Manages SG&A Costs Better?
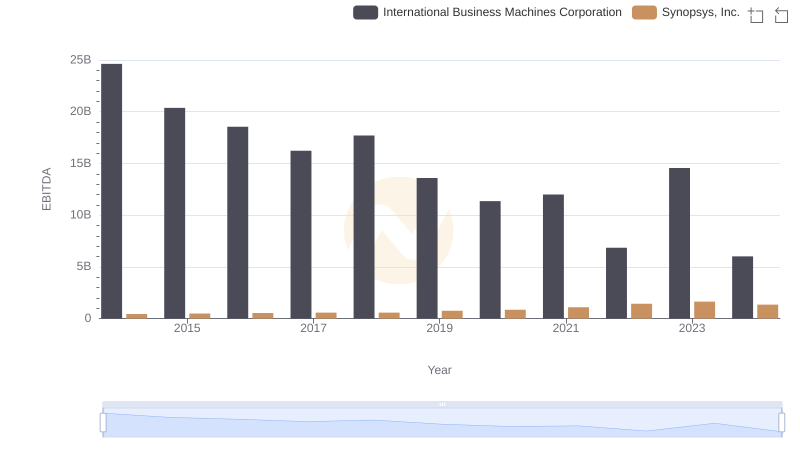
International Business Machines Corporation and Synopsys, Inc.: A Detailed Examination of EBITDA Performance