| __timestamp | International Business Machines Corporation | Synopsys, Inc. |
|---|---|---|
| Wednesday, January 1, 2014 | 92793000000 | 2057472000 |
| Thursday, January 1, 2015 | 81742000000 | 2242211000 |
| Friday, January 1, 2016 | 79920000000 | 2422532000 |
| Sunday, January 1, 2017 | 79139000000 | 2724880000 |
| Monday, January 1, 2018 | 79591000000 | 3121058000 |
| Tuesday, January 1, 2019 | 57714000000 | 3360694000 |
| Wednesday, January 1, 2020 | 55179000000 | 3685281000 |
| Friday, January 1, 2021 | 57351000000 | 4204193000 |
| Saturday, January 1, 2022 | 60530000000 | 5081542000 |
| Sunday, January 1, 2023 | 61860000000 | 5842619000 |
| Monday, January 1, 2024 | 62753000000 | 6127436000 |
Unveiling the hidden dimensions of data
In the ever-evolving landscape of technology, International Business Machines Corporation (IBM) and Synopsys, Inc. stand as titans with distinct trajectories. Over the past decade, IBM's annual revenue has seen a decline of approximately 32%, from $92.8 billion in 2014 to $62.8 billion in 2024. This trend reflects IBM's strategic shift towards cloud computing and AI, amidst a challenging market environment.
Conversely, Synopsys, a leader in electronic design automation, has experienced a robust growth of nearly 200% in the same period, with revenues climbing from $2.1 billion to $6.1 billion. This surge underscores Synopsys' pivotal role in the semiconductor industry, driven by the global demand for advanced chip design.
These contrasting paths highlight the dynamic nature of the tech industry, where adaptability and innovation are key to sustaining growth.
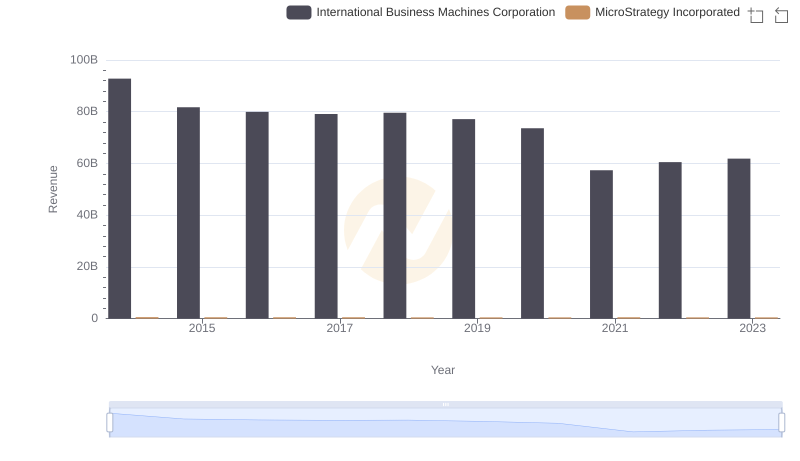
Revenue Insights: International Business Machines Corporation and MicroStrategy Incorporated Performance Compared
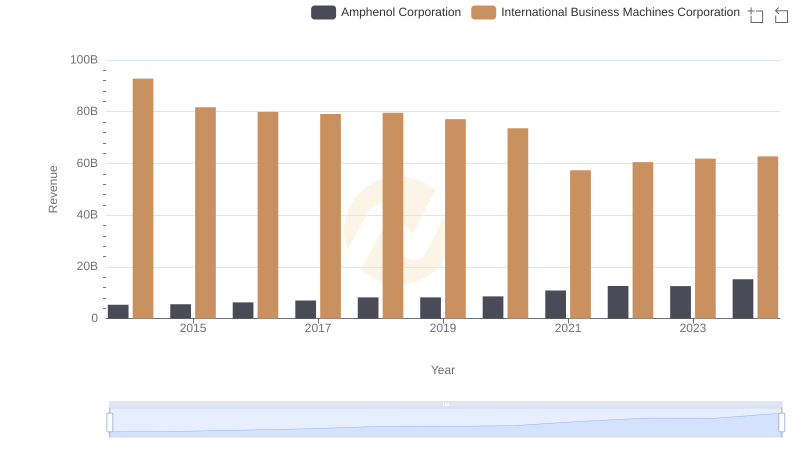
Revenue Insights: International Business Machines Corporation and Amphenol Corporation Performance Compared
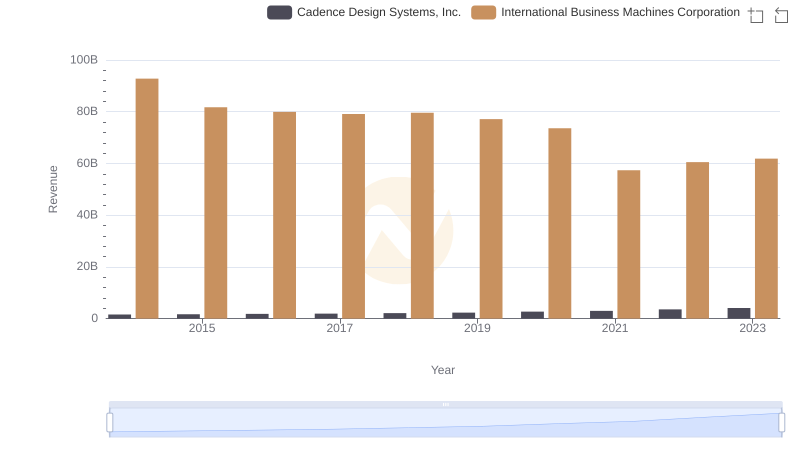
International Business Machines Corporation or Cadence Design Systems, Inc.: Who Leads in Yearly Revenue?
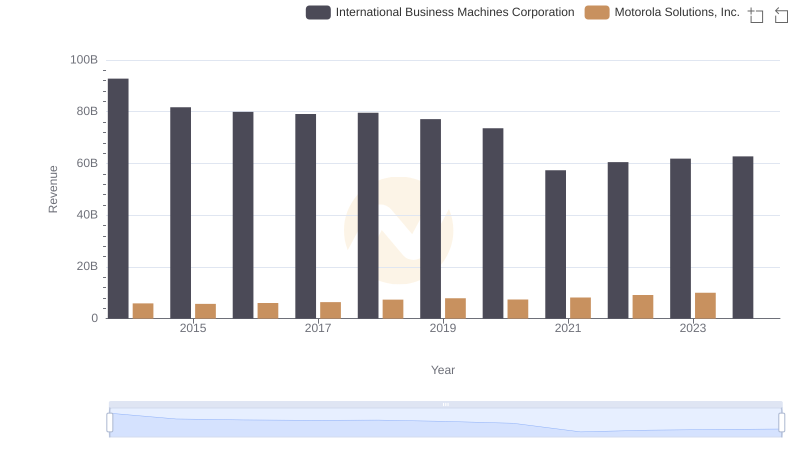
International Business Machines Corporation and Motorola Solutions, Inc.: A Comprehensive Revenue Analysis

Cost of Revenue Comparison: International Business Machines Corporation vs Synopsys, Inc.
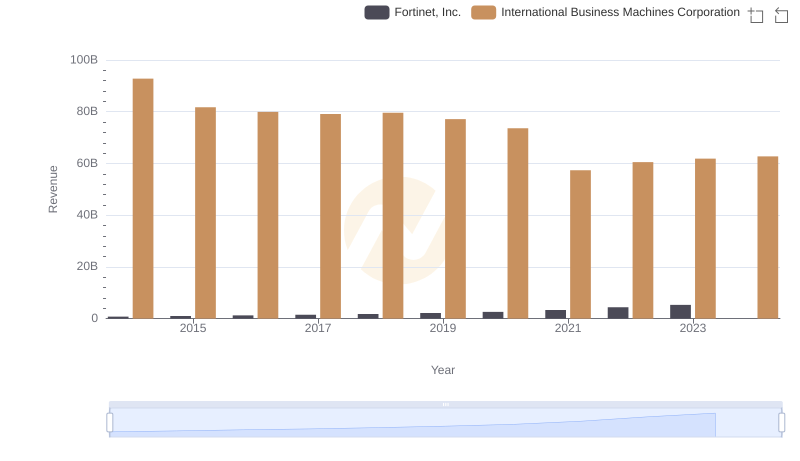
Revenue Insights: International Business Machines Corporation and Fortinet, Inc. Performance Compared
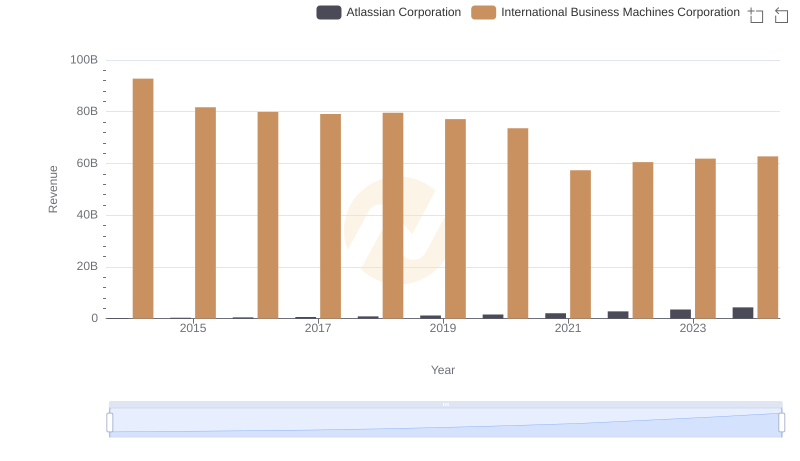
International Business Machines Corporation and Atlassian Corporation: A Comprehensive Revenue Analysis
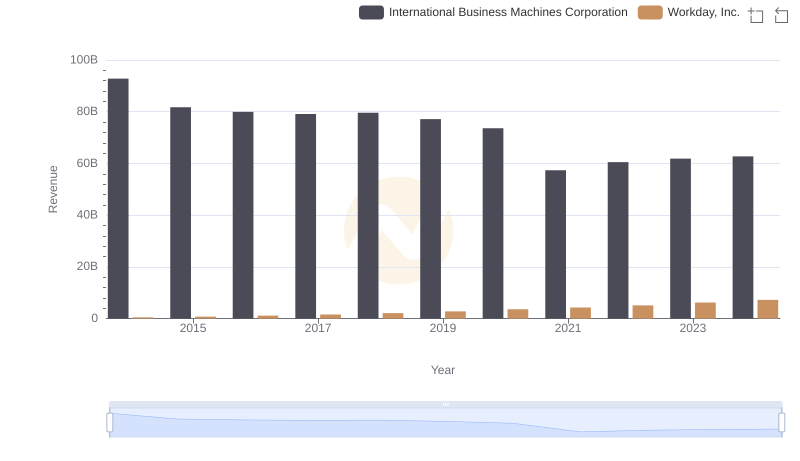
Revenue Insights: International Business Machines Corporation and Workday, Inc. Performance Compared
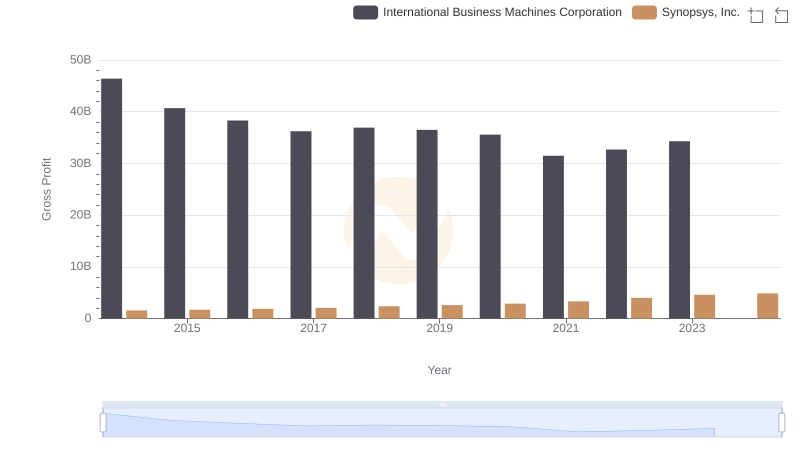
Key Insights on Gross Profit: International Business Machines Corporation vs Synopsys, Inc.
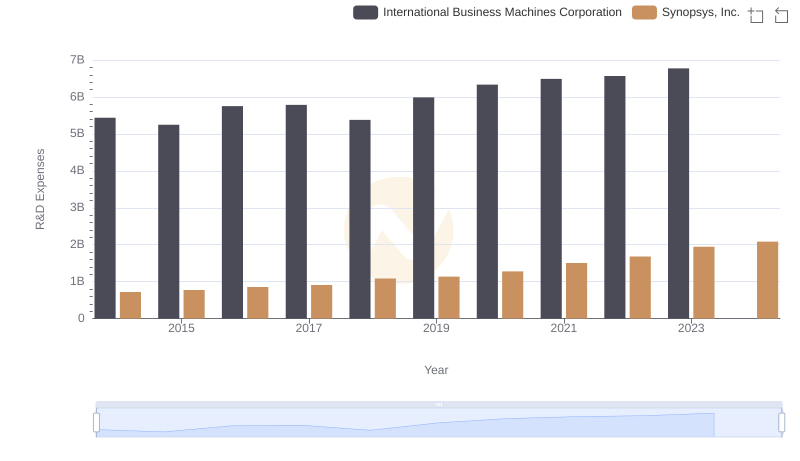
Who Prioritizes Innovation? R&D Spending Compared for International Business Machines Corporation and Synopsys, Inc.
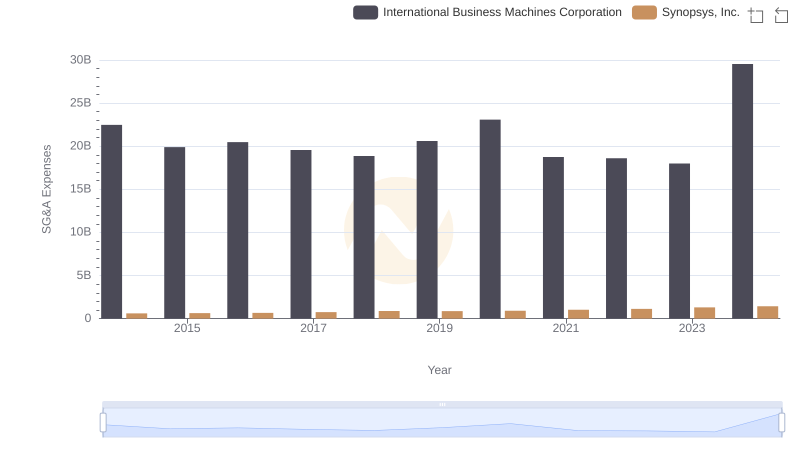
International Business Machines Corporation or Synopsys, Inc.: Who Manages SG&A Costs Better?
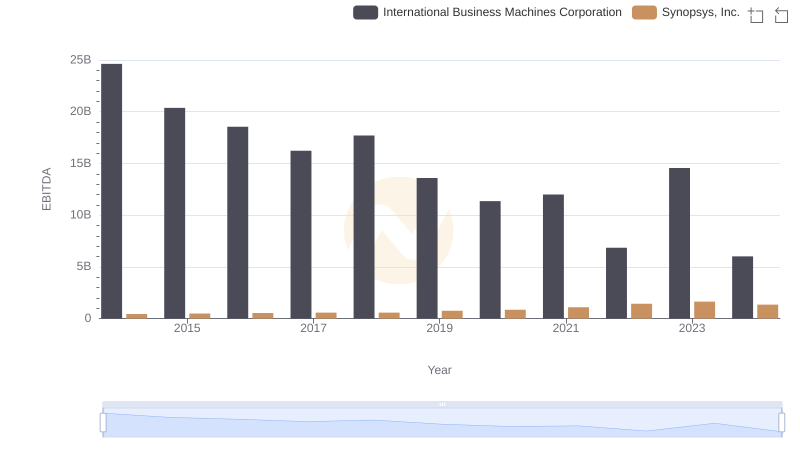
International Business Machines Corporation and Synopsys, Inc.: A Detailed Examination of EBITDA Performance