| __timestamp | International Business Machines Corporation | NXP Semiconductors N.V. |
|---|---|---|
| Wednesday, January 1, 2014 | 92793000000 | 5647000000 |
| Thursday, January 1, 2015 | 81742000000 | 6101000000 |
| Friday, January 1, 2016 | 79920000000 | 9498000000 |
| Sunday, January 1, 2017 | 79139000000 | 9256000000 |
| Monday, January 1, 2018 | 79591000000 | 9407000000 |
| Tuesday, January 1, 2019 | 57714000000 | 8877000000 |
| Wednesday, January 1, 2020 | 55179000000 | 8612000000 |
| Friday, January 1, 2021 | 57351000000 | 11063000000 |
| Saturday, January 1, 2022 | 60530000000 | 13205000000 |
| Sunday, January 1, 2023 | 61860000000 | 13276000000 |
| Monday, January 1, 2024 | 62753000000 |
Unleashing the power of data
In the ever-evolving tech landscape, revenue performance is a key indicator of a company's market position. This analysis pits two industry giants, International Business Machines Corporation (IBM) and NXP Semiconductors N.V., against each other from 2014 to 2023.
IBM, a stalwart in the tech industry, saw its revenue decline by approximately 33% over the decade, from $92.8 billion in 2014 to $62.8 billion in 2023. This trend reflects IBM's strategic shift towards cloud computing and AI, which may have initially impacted its traditional revenue streams.
Conversely, NXP Semiconductors, a leader in the semiconductor sector, experienced a remarkable 135% increase in revenue, from $5.6 billion in 2014 to $13.3 billion in 2023. This growth underscores the rising demand for semiconductors in automotive and IoT applications.
While IBM's revenue trajectory shows signs of stabilization, NXP's growth story is compelling, albeit with some missing data for 2024. This comparison highlights the dynamic nature of the tech industry and the diverse strategies companies employ to thrive.
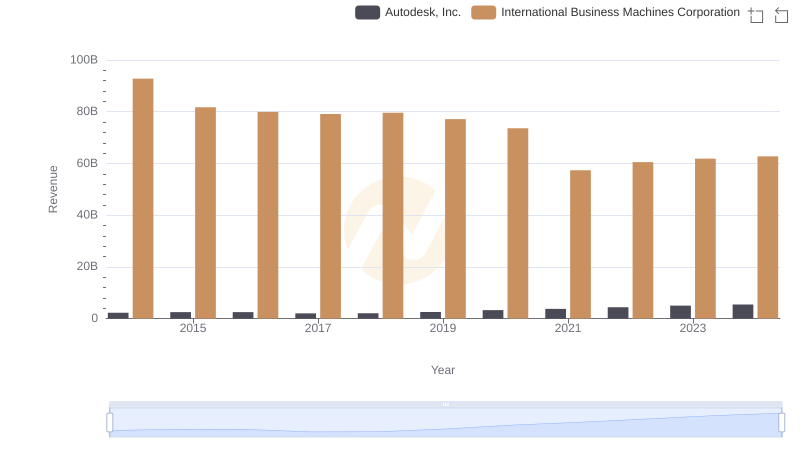
Breaking Down Revenue Trends: International Business Machines Corporation vs Autodesk, Inc.
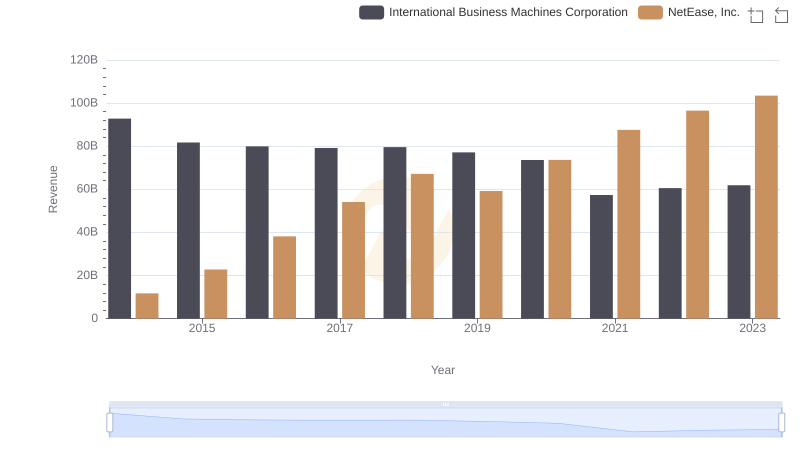
Comparing Revenue Performance: International Business Machines Corporation or NetEase, Inc.?
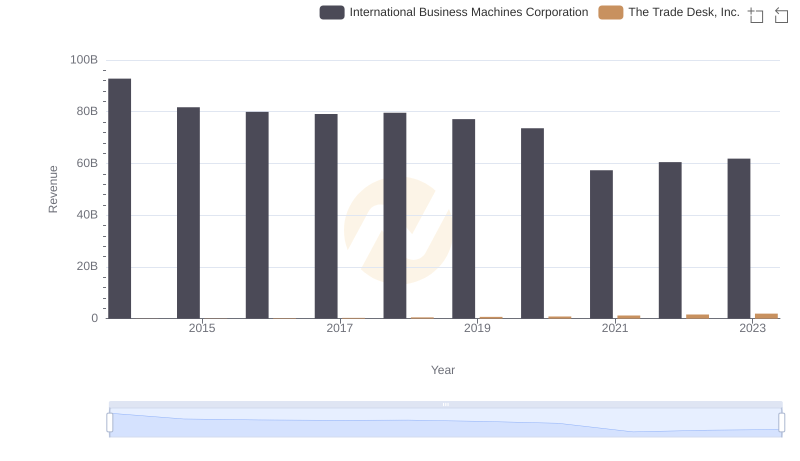
International Business Machines Corporation and The Trade Desk, Inc.: A Comprehensive Revenue Analysis
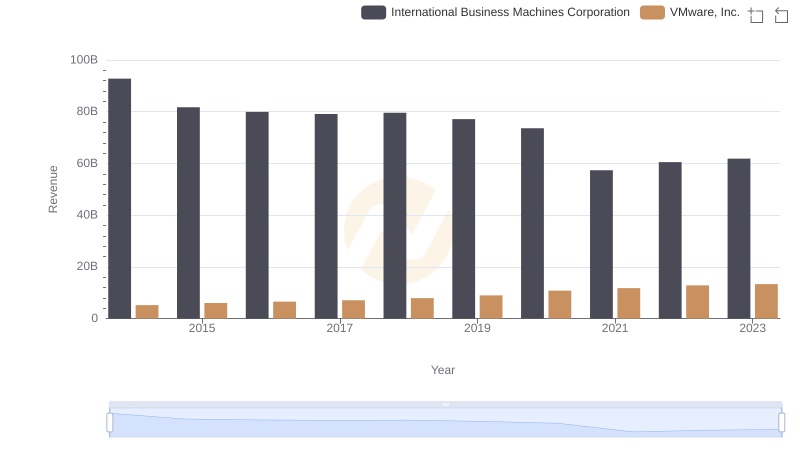
Revenue Insights: International Business Machines Corporation and VMware, Inc. Performance Compared
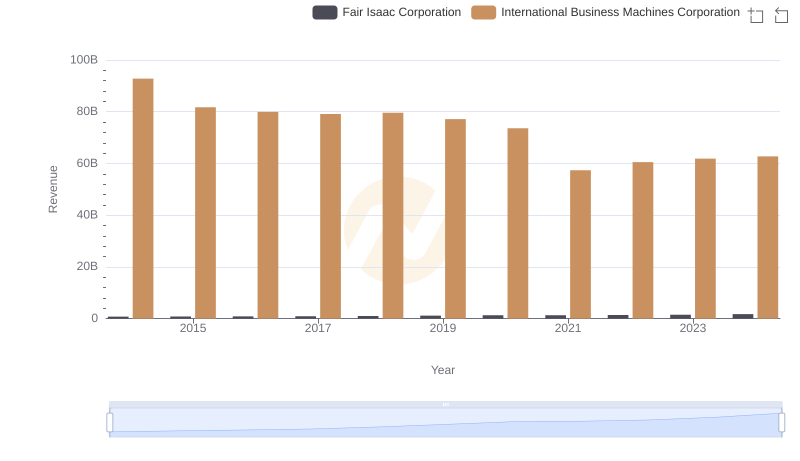
Revenue Showdown: International Business Machines Corporation vs Fair Isaac Corporation
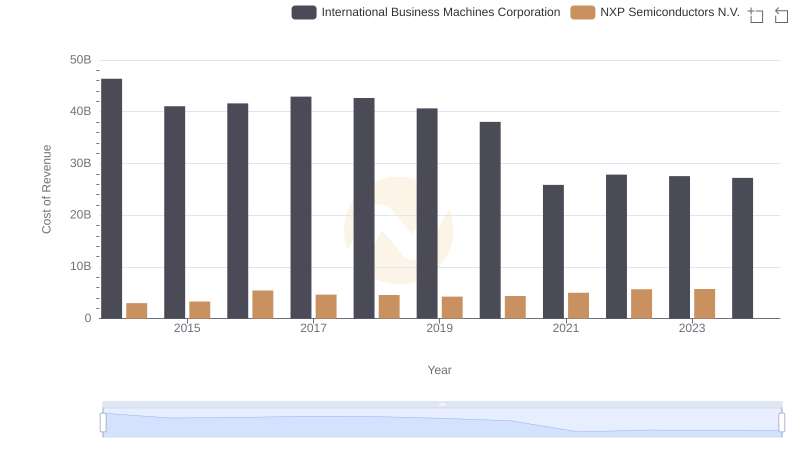
Cost of Revenue Comparison: International Business Machines Corporation vs NXP Semiconductors N.V.
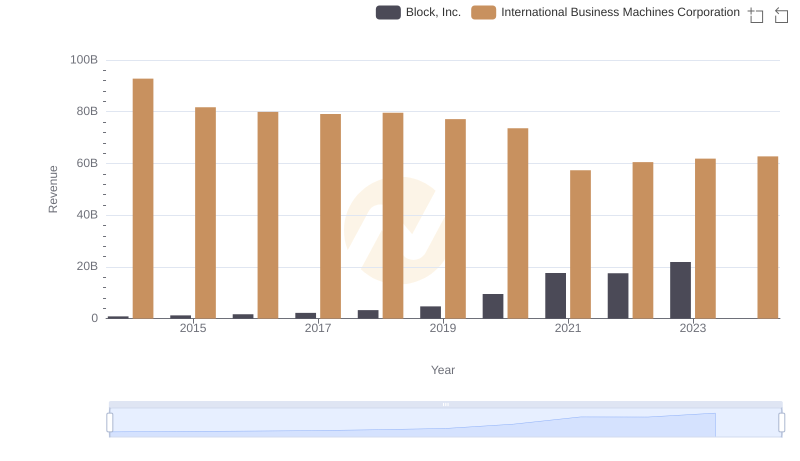
Who Generates More Revenue? International Business Machines Corporation or Block, Inc.
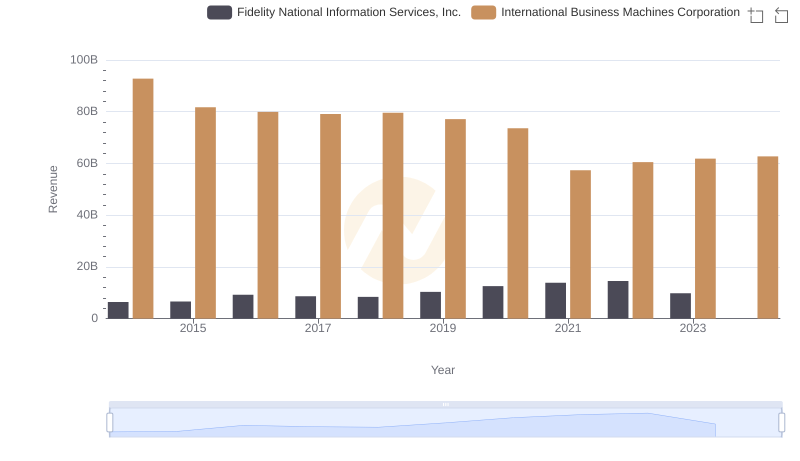
International Business Machines Corporation and Fidelity National Information Services, Inc.: A Comprehensive Revenue Analysis
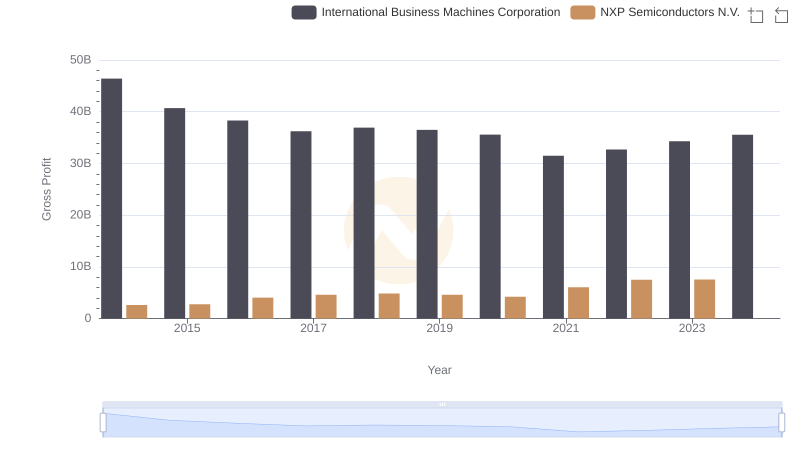
Gross Profit Comparison: International Business Machines Corporation and NXP Semiconductors N.V. Trends

R&D Insights: How International Business Machines Corporation and NXP Semiconductors N.V. Allocate Funds
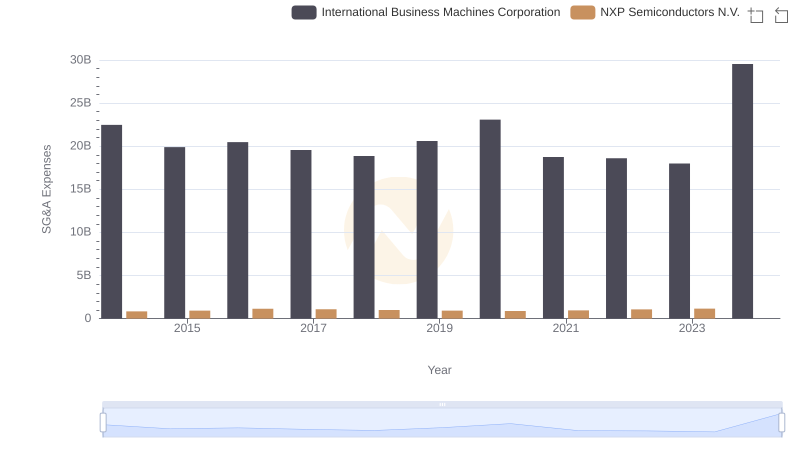
Selling, General, and Administrative Costs: International Business Machines Corporation vs NXP Semiconductors N.V.
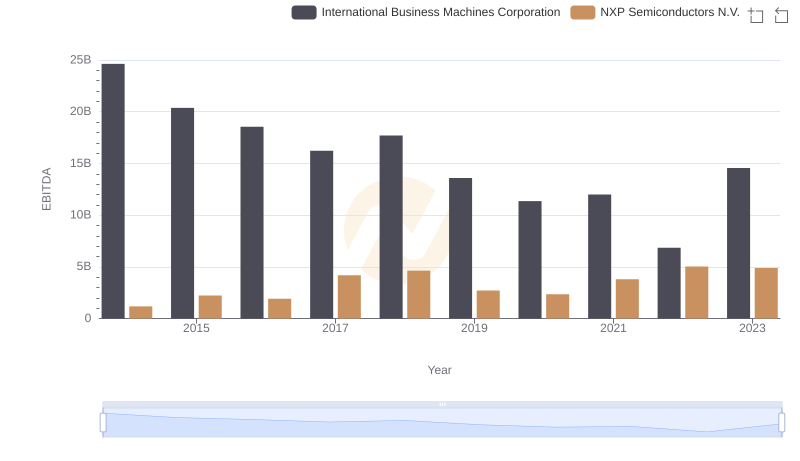
International Business Machines Corporation and NXP Semiconductors N.V.: A Detailed Examination of EBITDA Performance