| __timestamp | International Business Machines Corporation | NXP Semiconductors N.V. |
|---|---|---|
| Wednesday, January 1, 2014 | 22472000000 | 838000000 |
| Thursday, January 1, 2015 | 19894000000 | 922000000 |
| Friday, January 1, 2016 | 20279000000 | 1141000000 |
| Sunday, January 1, 2017 | 19680000000 | 1090000000 |
| Monday, January 1, 2018 | 19366000000 | 993000000 |
| Tuesday, January 1, 2019 | 18724000000 | 924000000 |
| Wednesday, January 1, 2020 | 20561000000 | 879000000 |
| Friday, January 1, 2021 | 18745000000 | 956000000 |
| Saturday, January 1, 2022 | 17483000000 | 1066000000 |
| Sunday, January 1, 2023 | 17997000000 | 1159000000 |
| Monday, January 1, 2024 | 29536000000 |
Unleashing the power of data
In the ever-evolving tech industry, understanding the financial strategies of major players is crucial. This chart compares the Selling, General, and Administrative (SG&A) expenses of International Business Machines Corporation (IBM) and NXP Semiconductors N.V. from 2014 to 2023. IBM, a stalwart in the tech world, consistently reported SG&A expenses that were significantly higher than NXP's, reflecting its expansive global operations. In 2023, IBM's SG&A costs were approximately 15 times greater than NXP's, highlighting its larger scale and broader market reach. Interestingly, IBM's expenses peaked in 2024, suggesting a strategic shift or investment. Meanwhile, NXP's expenses remained relatively stable, indicating a focused and efficient operational model. This comparison not only sheds light on the financial health of these companies but also offers insights into their strategic priorities over the past decade.
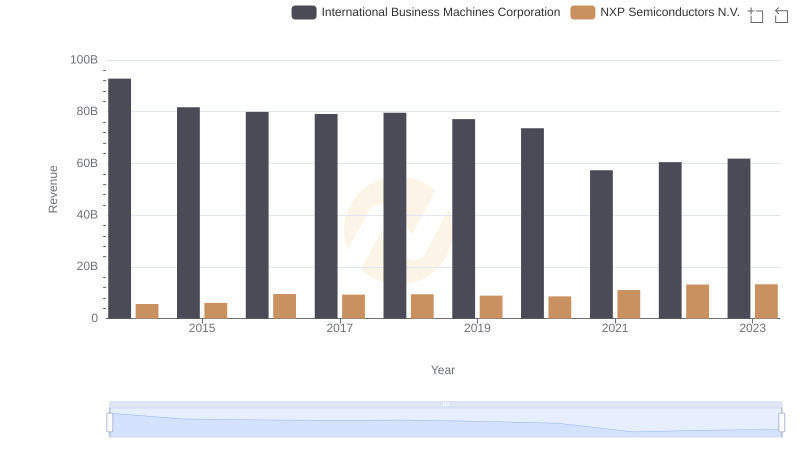
Comparing Revenue Performance: International Business Machines Corporation or NXP Semiconductors N.V.?
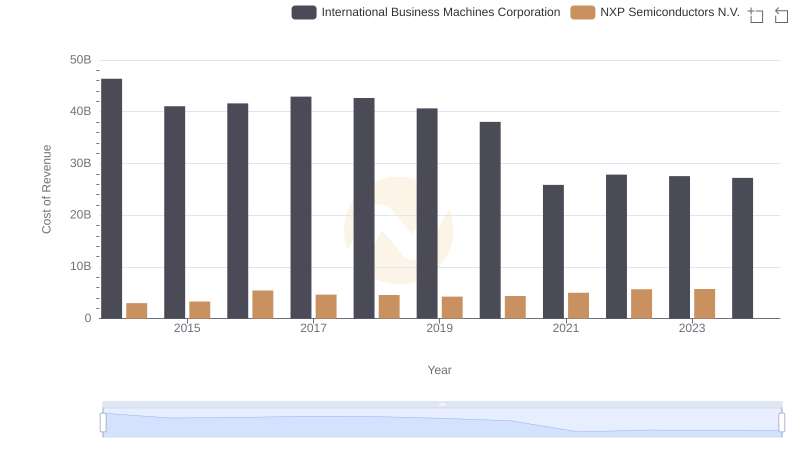
Cost of Revenue Comparison: International Business Machines Corporation vs NXP Semiconductors N.V.
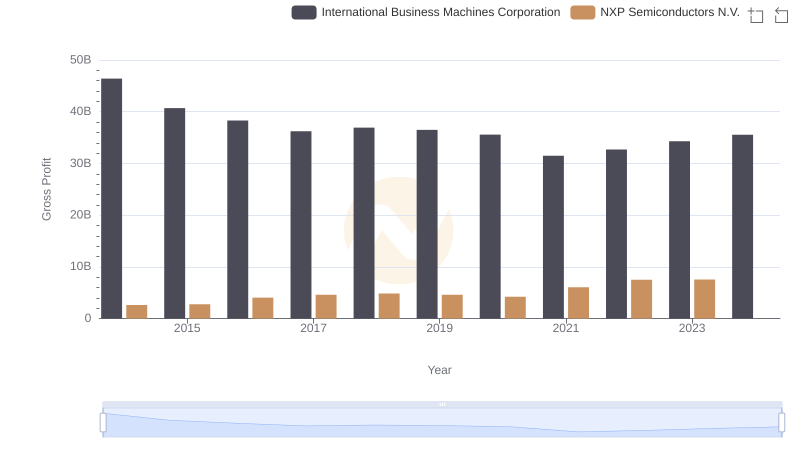
Gross Profit Comparison: International Business Machines Corporation and NXP Semiconductors N.V. Trends
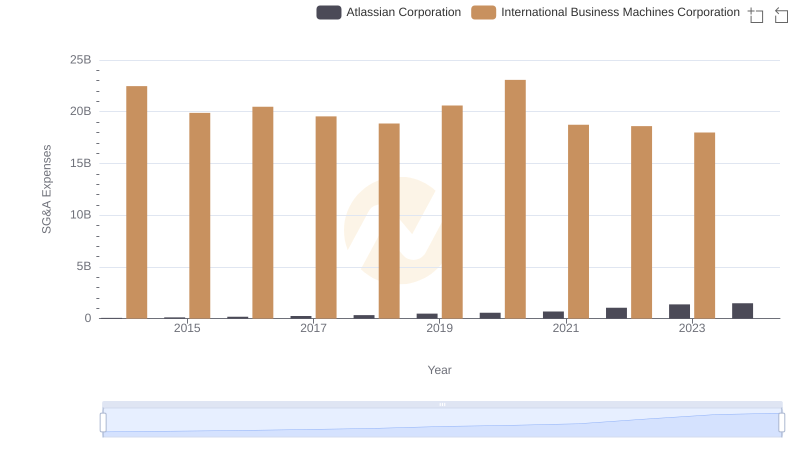
Operational Costs Compared: SG&A Analysis of International Business Machines Corporation and Atlassian Corporation

R&D Insights: How International Business Machines Corporation and NXP Semiconductors N.V. Allocate Funds
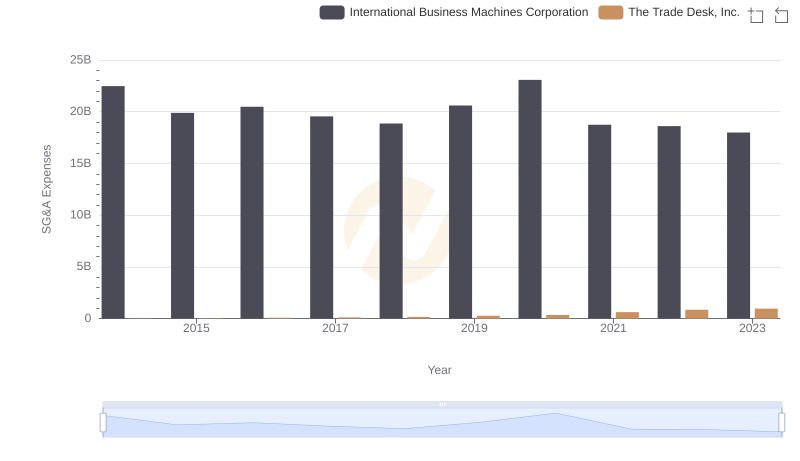
Operational Costs Compared: SG&A Analysis of International Business Machines Corporation and The Trade Desk, Inc.
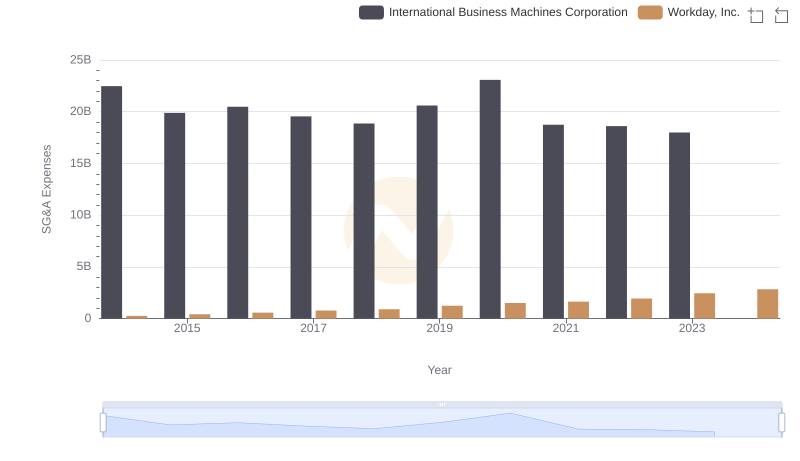
Who Optimizes SG&A Costs Better? International Business Machines Corporation or Workday, Inc.
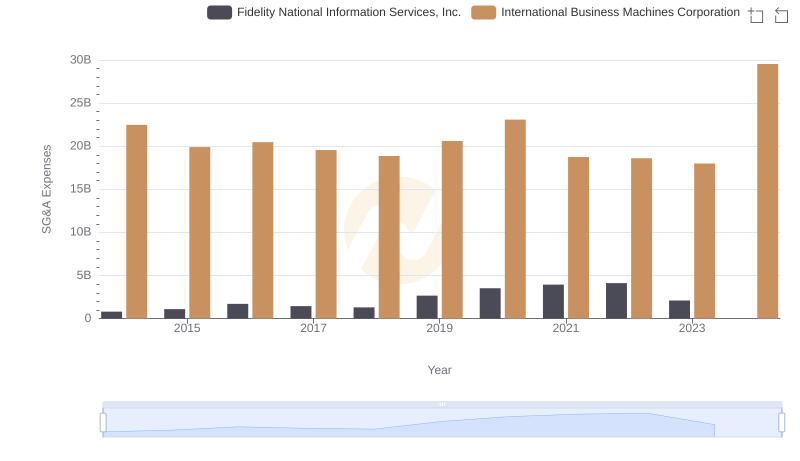
Comparing SG&A Expenses: International Business Machines Corporation vs Fidelity National Information Services, Inc. Trends and Insights
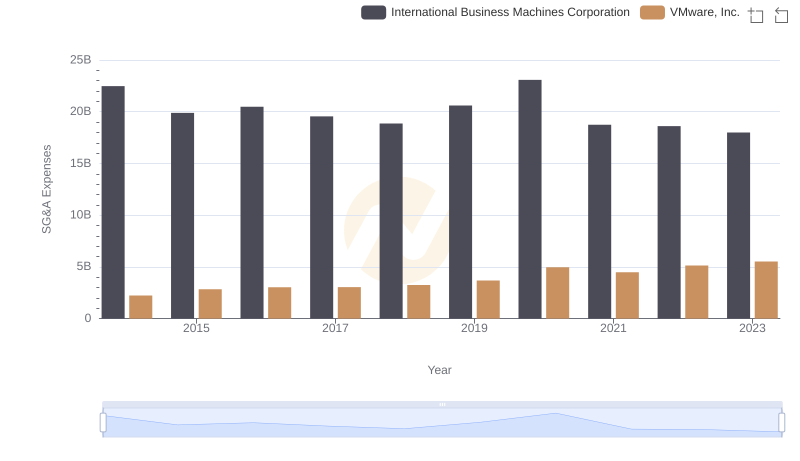
Breaking Down SG&A Expenses: International Business Machines Corporation vs VMware, Inc.
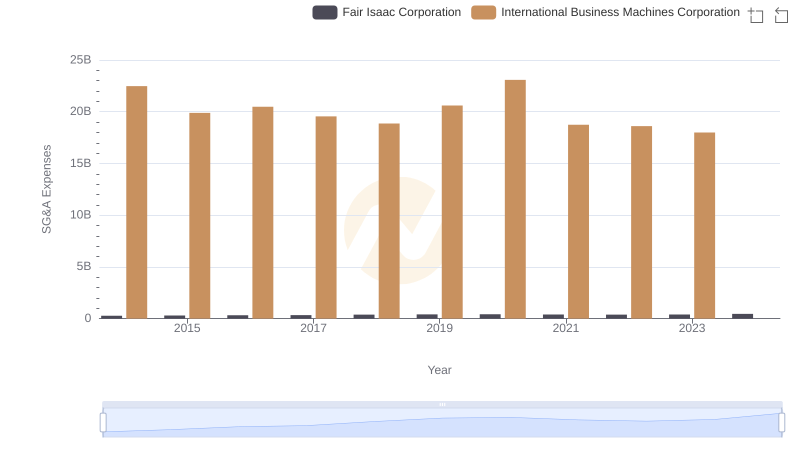
International Business Machines Corporation or Fair Isaac Corporation: Who Manages SG&A Costs Better?
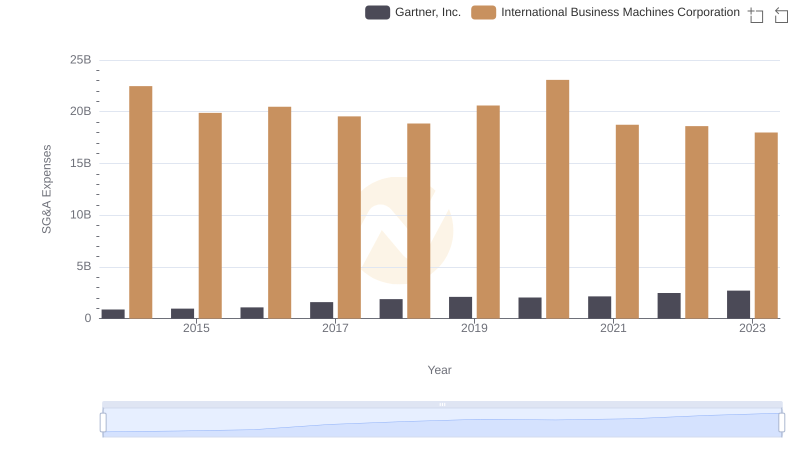
SG&A Efficiency Analysis: Comparing International Business Machines Corporation and Gartner, Inc.
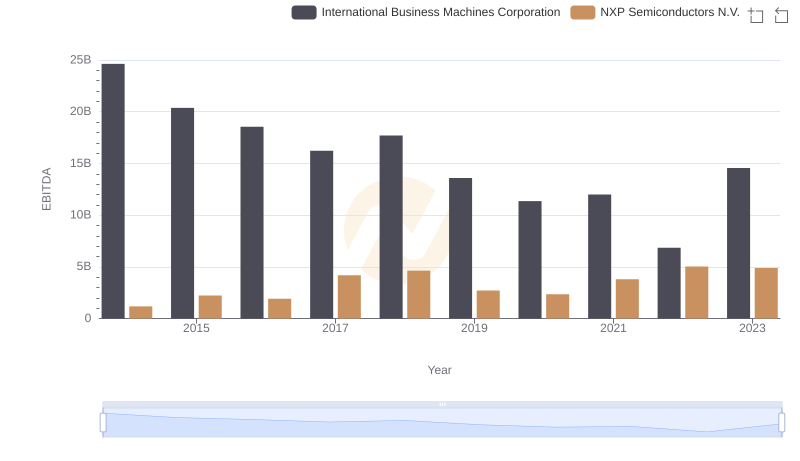
International Business Machines Corporation and NXP Semiconductors N.V.: A Detailed Examination of EBITDA Performance