| __timestamp | Infosys Limited | Splunk Inc. |
|---|---|---|
| Wednesday, January 1, 2014 | 1079000000 | 269210000 |
| Thursday, January 1, 2015 | 1176000000 | 447517000 |
| Friday, January 1, 2016 | 1020000000 | 626927000 |
| Sunday, January 1, 2017 | 1279000000 | 806883000 |
| Monday, January 1, 2018 | 1220000000 | 967560000 |
| Tuesday, January 1, 2019 | 1504000000 | 1267538000 |
| Wednesday, January 1, 2020 | 1223000000 | 1596475000 |
| Friday, January 1, 2021 | 1391000000 | 1671200000 |
| Saturday, January 1, 2022 | 1678000000 | 2056950000 |
| Sunday, January 1, 2023 | 1632000000 | 2076049000 |
| Monday, January 1, 2024 | 2074630000 |
Unveiling the hidden dimensions of data
In the ever-evolving landscape of global business, understanding the financial strategies of leading companies is crucial. This analysis delves into the Selling, General, and Administrative (SG&A) expenses of two tech giants: Infosys Limited and Splunk Inc., from 2014 to 2023.
Over the past decade, Infosys Limited has shown a steady increase in SG&A expenses, peaking in 2022 with a 55% rise from 2014. Meanwhile, Splunk Inc. has experienced a more dramatic surge, with expenses growing nearly eightfold, reflecting its aggressive expansion strategy.
This data provides a window into the strategic priorities of these industry leaders, offering valuable insights for investors and analysts alike.
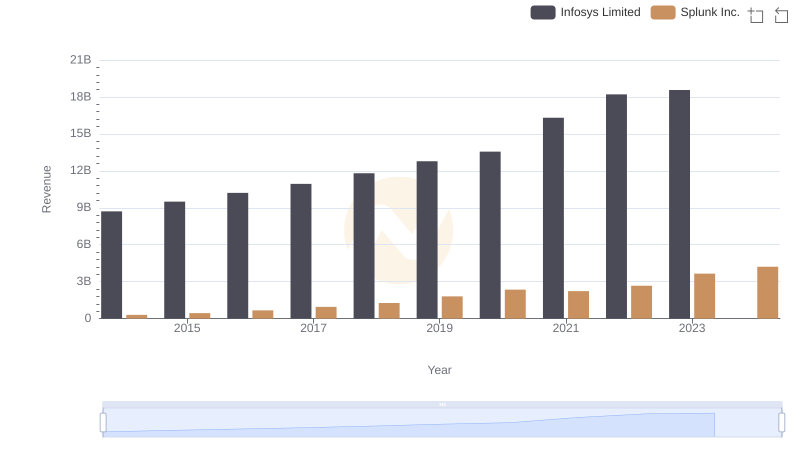
Breaking Down Revenue Trends: Infosys Limited vs Splunk Inc.
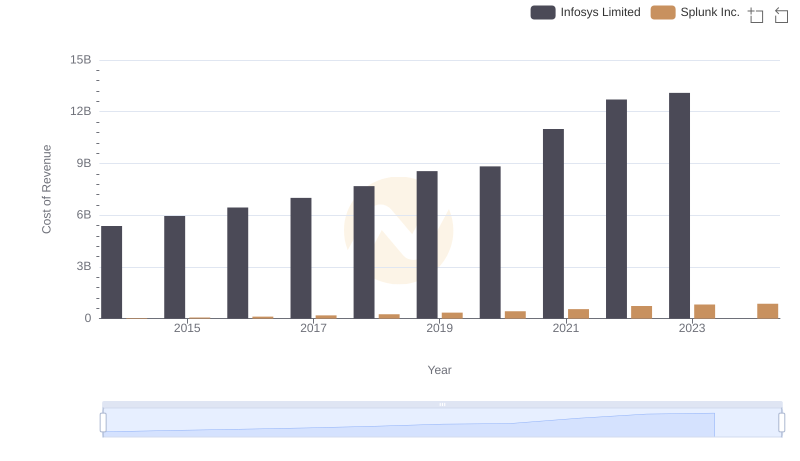
Infosys Limited vs Splunk Inc.: Efficiency in Cost of Revenue Explored
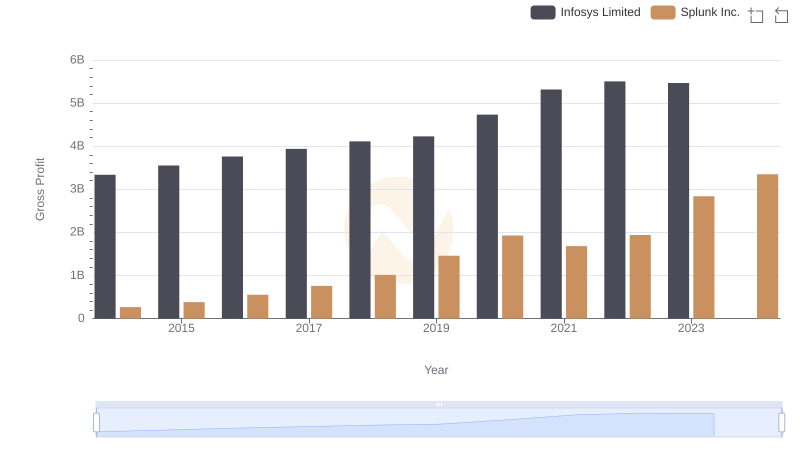
Infosys Limited and Splunk Inc.: A Detailed Gross Profit Analysis
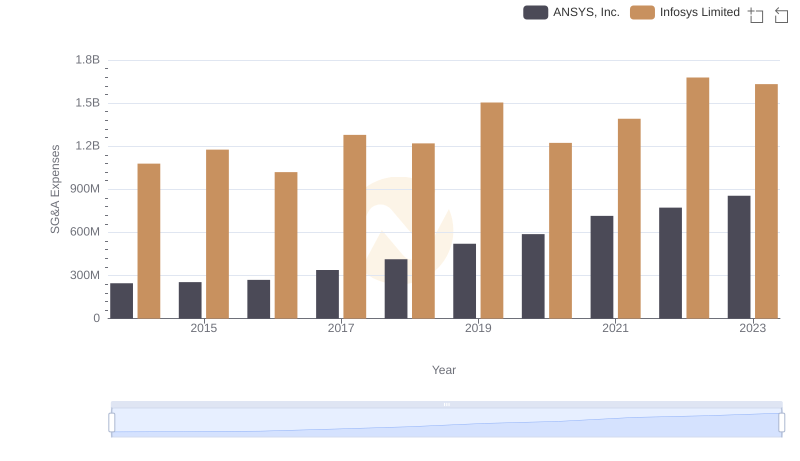
Comparing SG&A Expenses: Infosys Limited vs ANSYS, Inc. Trends and Insights
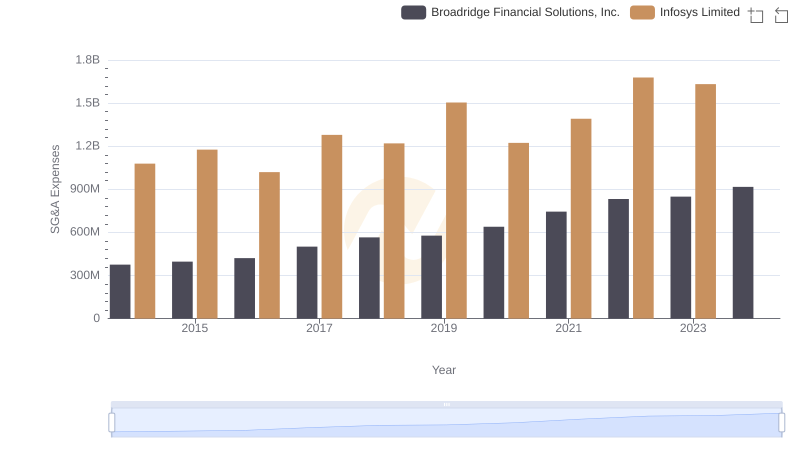
Comparing SG&A Expenses: Infosys Limited vs Broadridge Financial Solutions, Inc. Trends and Insights
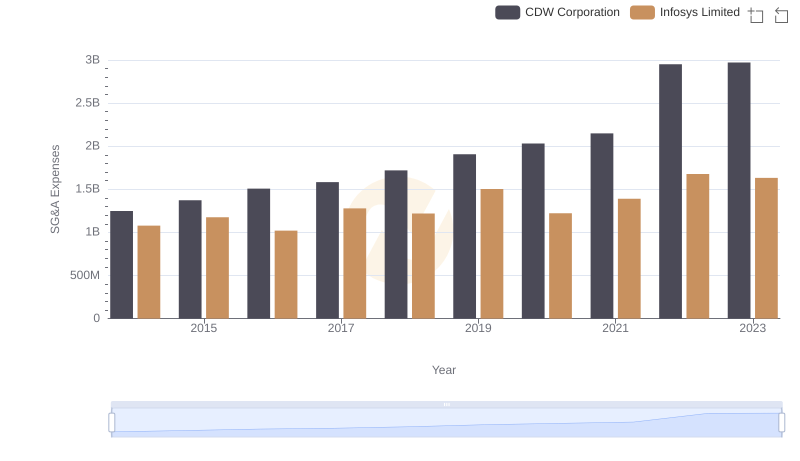
Operational Costs Compared: SG&A Analysis of Infosys Limited and CDW Corporation
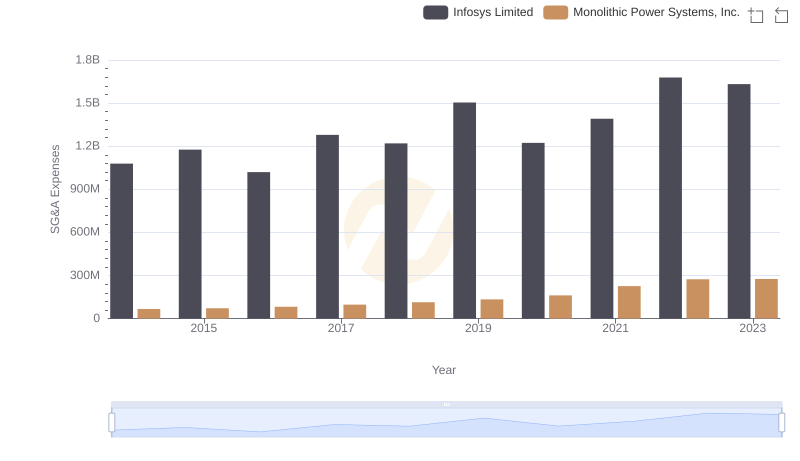
SG&A Efficiency Analysis: Comparing Infosys Limited and Monolithic Power Systems, Inc.
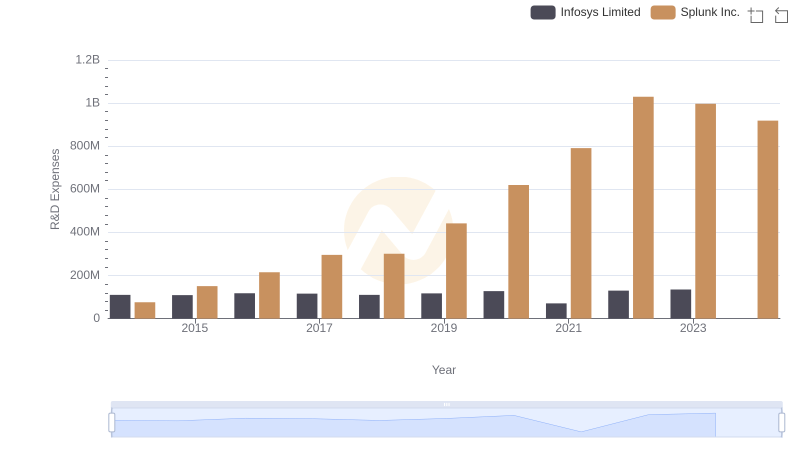
R&D Insights: How Infosys Limited and Splunk Inc. Allocate Funds
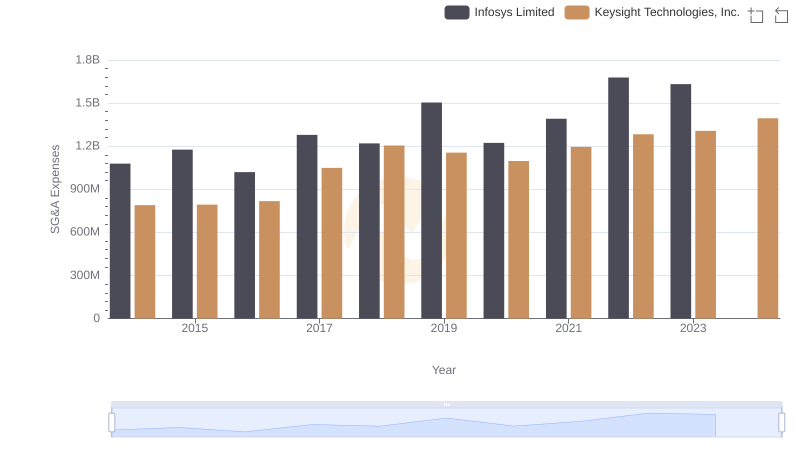
SG&A Efficiency Analysis: Comparing Infosys Limited and Keysight Technologies, Inc.
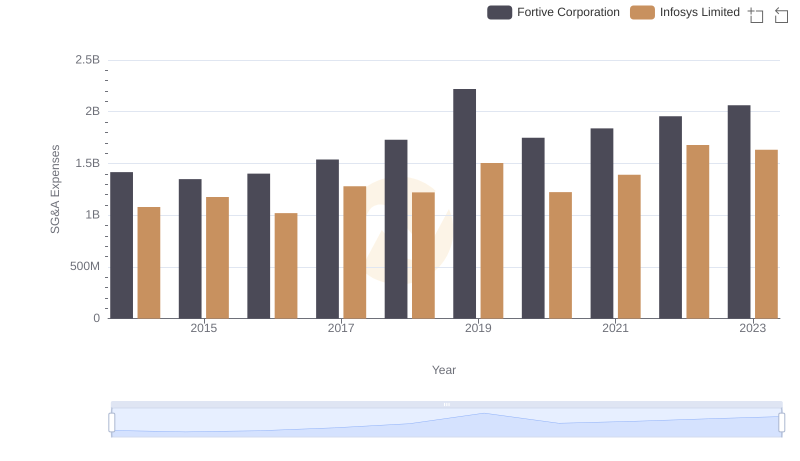
Infosys Limited vs Fortive Corporation: SG&A Expense Trends
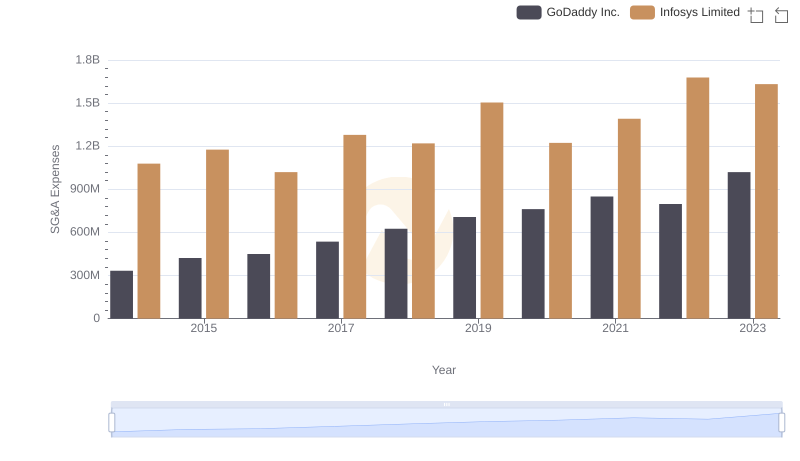
Selling, General, and Administrative Costs: Infosys Limited vs GoDaddy Inc.
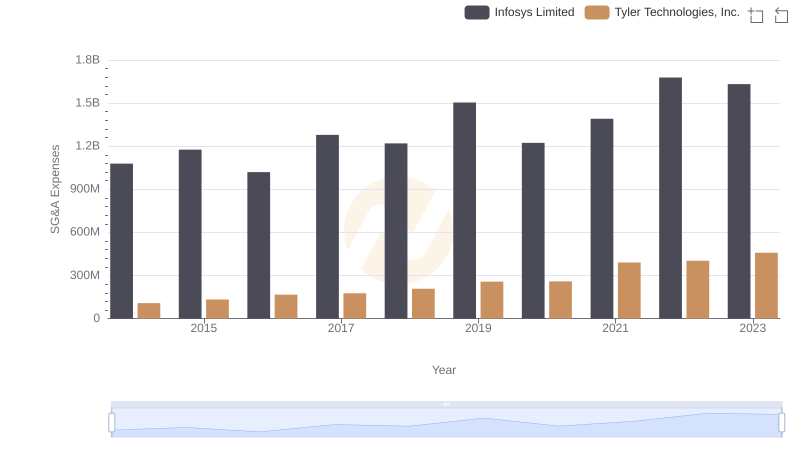
Selling, General, and Administrative Costs: Infosys Limited vs Tyler Technologies, Inc.