| __timestamp | Broadridge Financial Solutions, Inc. | Infosys Limited |
|---|---|---|
| Wednesday, January 1, 2014 | 376000000 | 1079000000 |
| Thursday, January 1, 2015 | 396800000 | 1176000000 |
| Friday, January 1, 2016 | 420900000 | 1020000000 |
| Sunday, January 1, 2017 | 501400000 | 1279000000 |
| Monday, January 1, 2018 | 565400000 | 1220000000 |
| Tuesday, January 1, 2019 | 577500000 | 1504000000 |
| Wednesday, January 1, 2020 | 639000000 | 1223000000 |
| Friday, January 1, 2021 | 744300000 | 1391000000 |
| Saturday, January 1, 2022 | 832300000 | 1678000000 |
| Sunday, January 1, 2023 | 849000000 | 1632000000 |
| Monday, January 1, 2024 | 916800000 |
Igniting the spark of knowledge
In the ever-evolving landscape of global business, understanding the financial strategies of industry leaders is crucial. This analysis delves into the Selling, General, and Administrative (SG&A) expenses of two prominent companies: Infosys Limited and Broadridge Financial Solutions, Inc., from 2014 to 2023.
Over the past decade, Infosys Limited has consistently outpaced Broadridge in SG&A expenses, reflecting its expansive global operations. In 2022, Infosys's SG&A expenses were approximately 101% higher than Broadridge's, highlighting its significant investment in administrative and sales functions. However, Broadridge has shown a remarkable growth trajectory, with a 144% increase in SG&A expenses from 2014 to 2023, compared to Infosys's 51% growth over the same period.
It's noteworthy that the 2024 data for Infosys is unavailable, which could impact future trend analysis. This gap underscores the importance of continuous data monitoring for accurate financial insights.
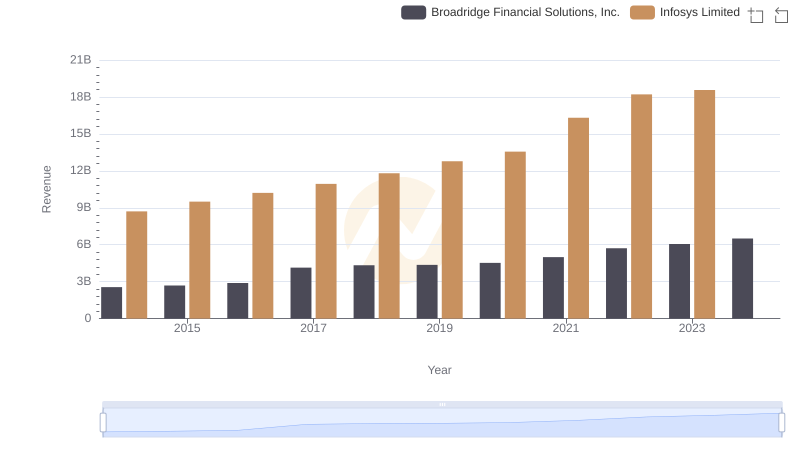
Breaking Down Revenue Trends: Infosys Limited vs Broadridge Financial Solutions, Inc.
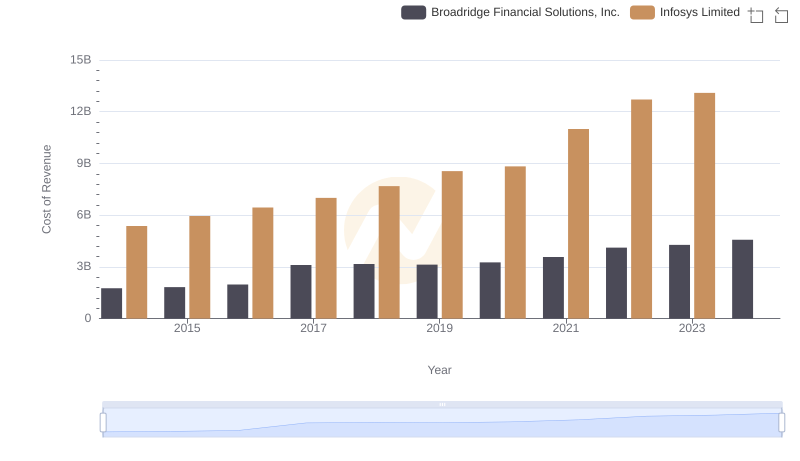
Comparing Cost of Revenue Efficiency: Infosys Limited vs Broadridge Financial Solutions, Inc.
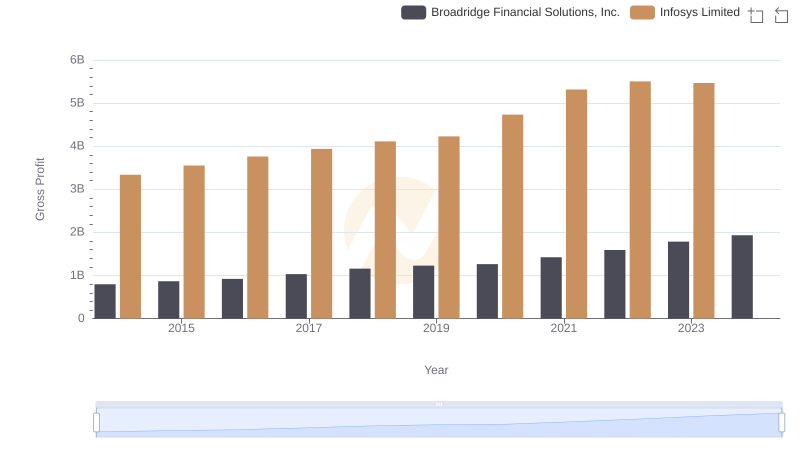
Gross Profit Comparison: Infosys Limited and Broadridge Financial Solutions, Inc. Trends
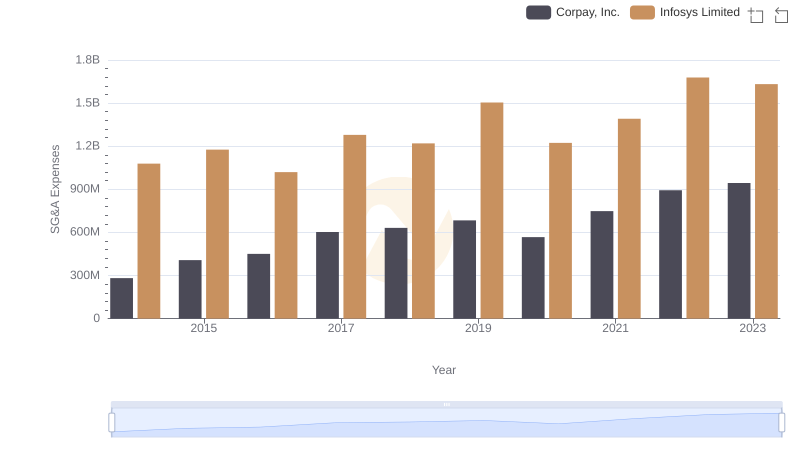
Comparing SG&A Expenses: Infosys Limited vs Corpay, Inc. Trends and Insights
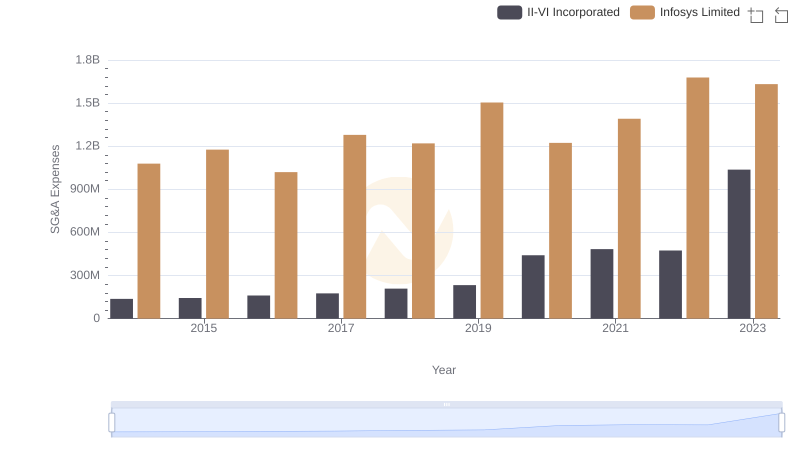
Cost Management Insights: SG&A Expenses for Infosys Limited and II-VI Incorporated
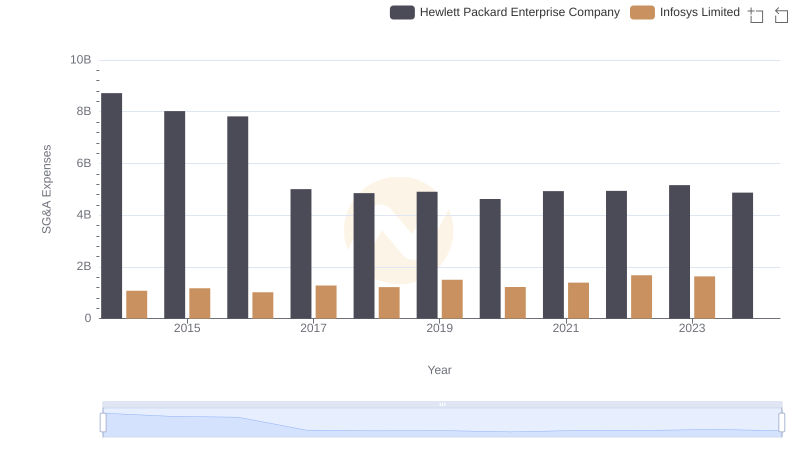
Who Optimizes SG&A Costs Better? Infosys Limited or Hewlett Packard Enterprise Company
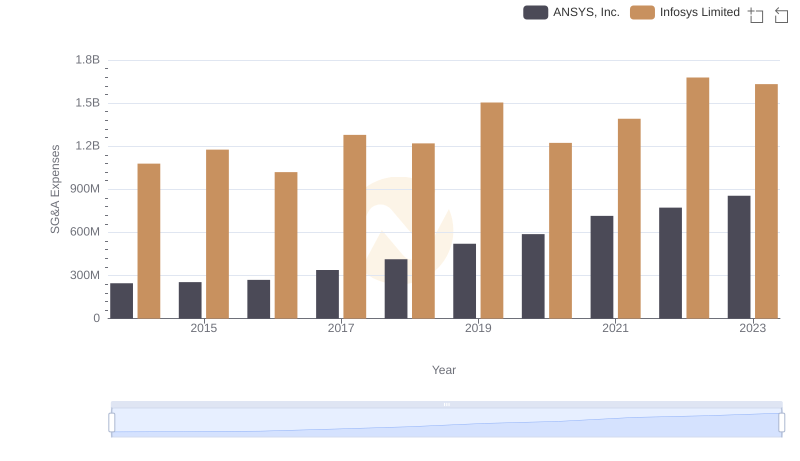
Comparing SG&A Expenses: Infosys Limited vs ANSYS, Inc. Trends and Insights
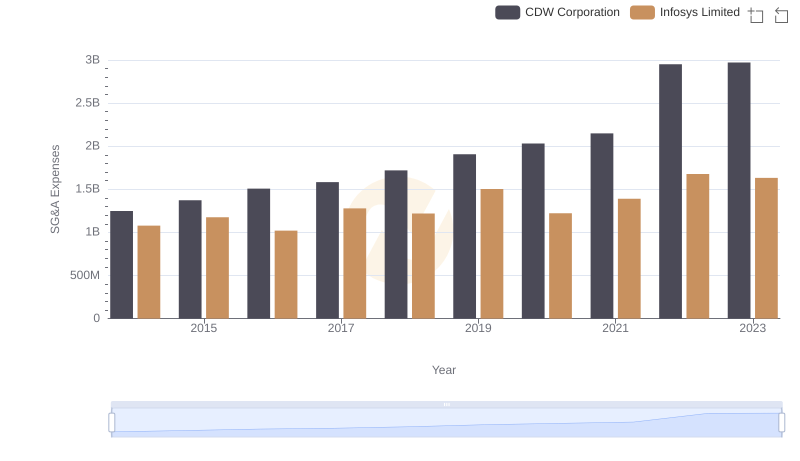
Operational Costs Compared: SG&A Analysis of Infosys Limited and CDW Corporation
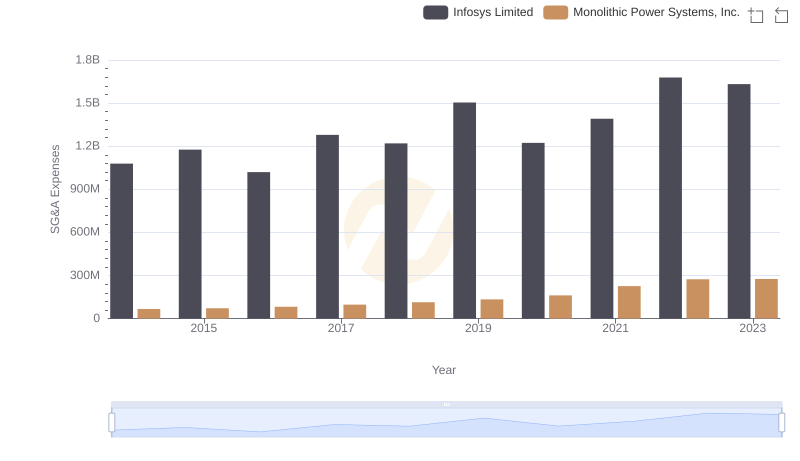
SG&A Efficiency Analysis: Comparing Infosys Limited and Monolithic Power Systems, Inc.
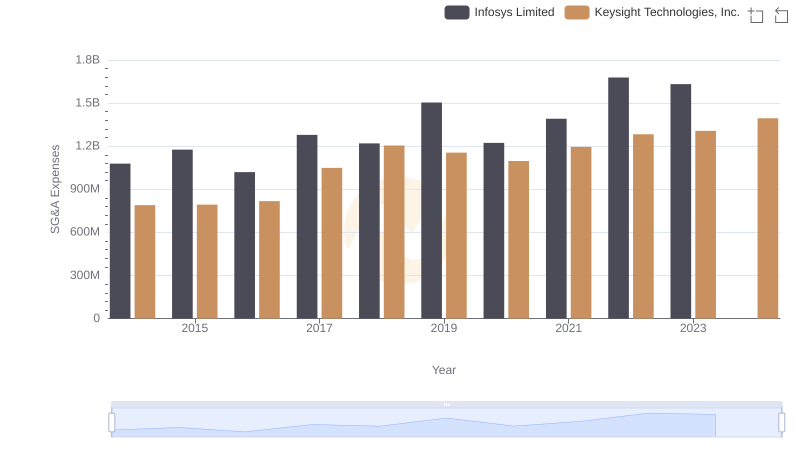
SG&A Efficiency Analysis: Comparing Infosys Limited and Keysight Technologies, Inc.
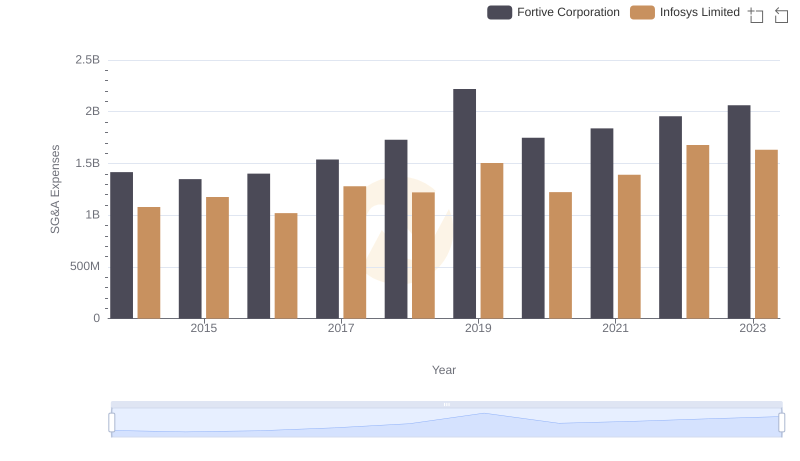
Infosys Limited vs Fortive Corporation: SG&A Expense Trends
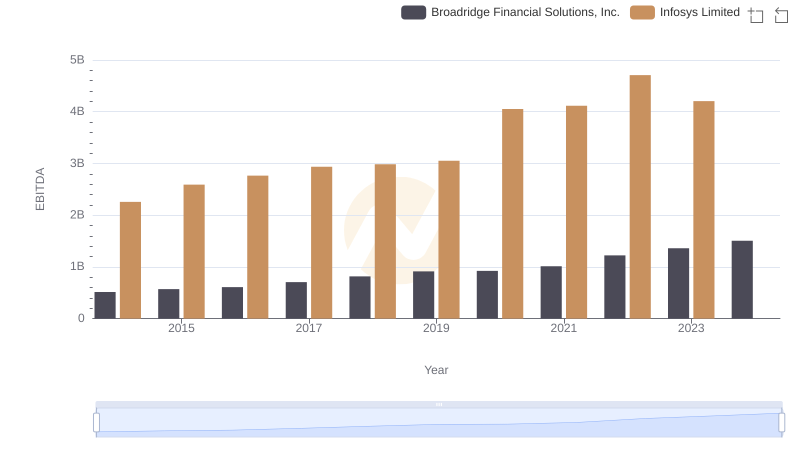
Infosys Limited and Broadridge Financial Solutions, Inc.: A Detailed Examination of EBITDA Performance