| __timestamp | Infosys Limited | Splunk Inc. |
|---|---|---|
| Wednesday, January 1, 2014 | 3337000000 | 266798000 |
| Thursday, January 1, 2015 | 3551000000 | 382497000 |
| Friday, January 1, 2016 | 3762000000 | 554313000 |
| Sunday, January 1, 2017 | 3938000000 | 758902000 |
| Monday, January 1, 2018 | 4112000000 | 1014379000 |
| Tuesday, January 1, 2019 | 4228000000 | 1458334000 |
| Wednesday, January 1, 2020 | 4733000000 | 1929138000 |
| Friday, January 1, 2021 | 5315000000 | 1682040000 |
| Saturday, January 1, 2022 | 5503000000 | 1939695000 |
| Sunday, January 1, 2023 | 5466000000 | 2837713000 |
| Monday, January 1, 2024 | 3350088000 |
Unleashing the power of data
In the ever-evolving landscape of global technology, Infosys Limited and Splunk Inc. have emerged as significant players. From 2014 to 2023, Infosys consistently demonstrated robust growth in gross profit, peaking in 2022 with a remarkable 65% increase from its 2014 figures. Meanwhile, Splunk Inc. showcased an impressive upward trajectory, with its gross profit surging over 960% during the same period, reflecting its dynamic expansion in the tech industry.
This analysis underscores the contrasting growth strategies and market positions of these two tech giants, offering valuable insights for investors and industry enthusiasts.
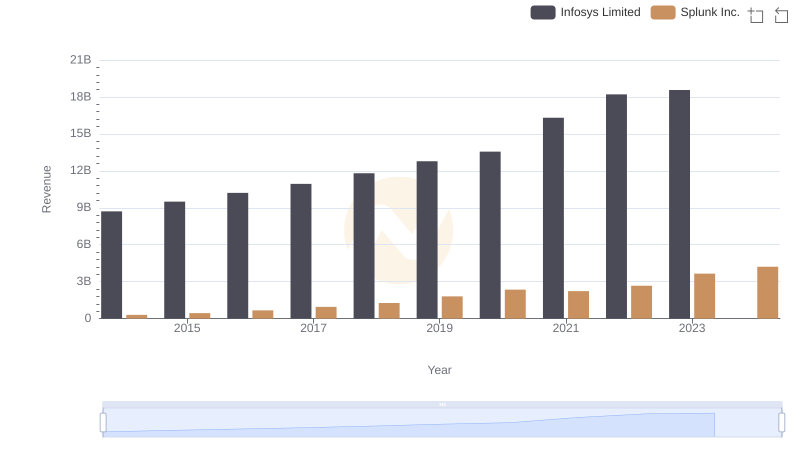
Breaking Down Revenue Trends: Infosys Limited vs Splunk Inc.
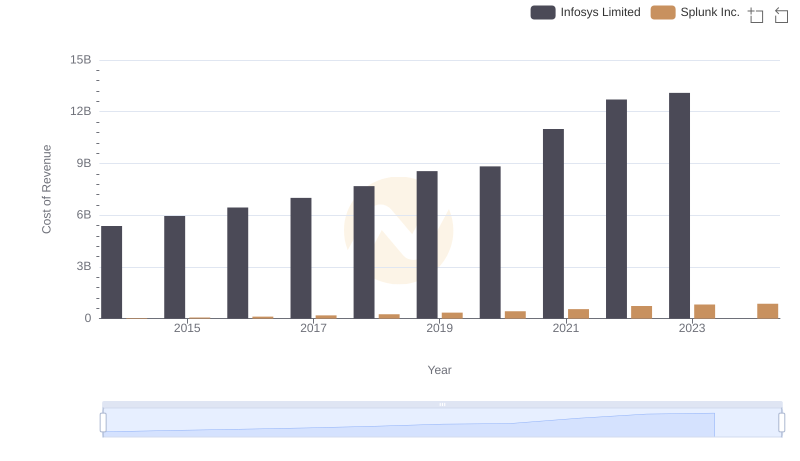
Infosys Limited vs Splunk Inc.: Efficiency in Cost of Revenue Explored
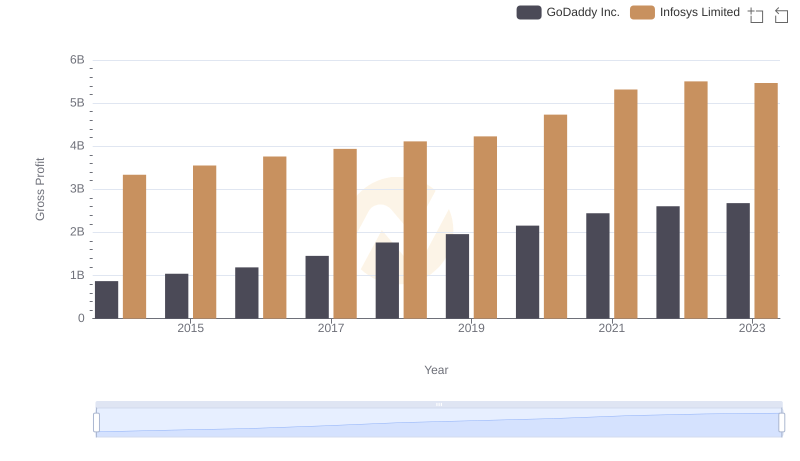
Gross Profit Trends Compared: Infosys Limited vs GoDaddy Inc.
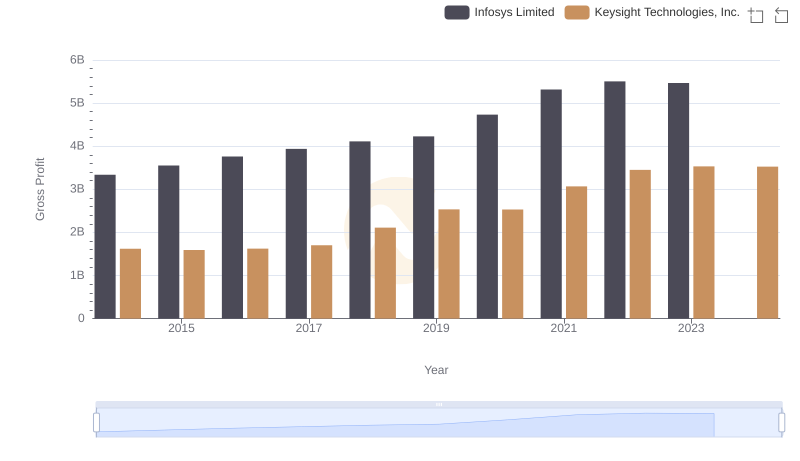
Gross Profit Comparison: Infosys Limited and Keysight Technologies, Inc. Trends
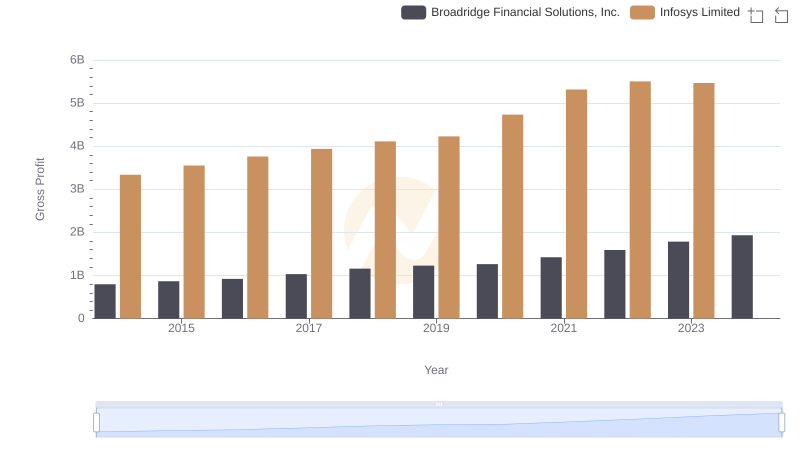
Gross Profit Comparison: Infosys Limited and Broadridge Financial Solutions, Inc. Trends
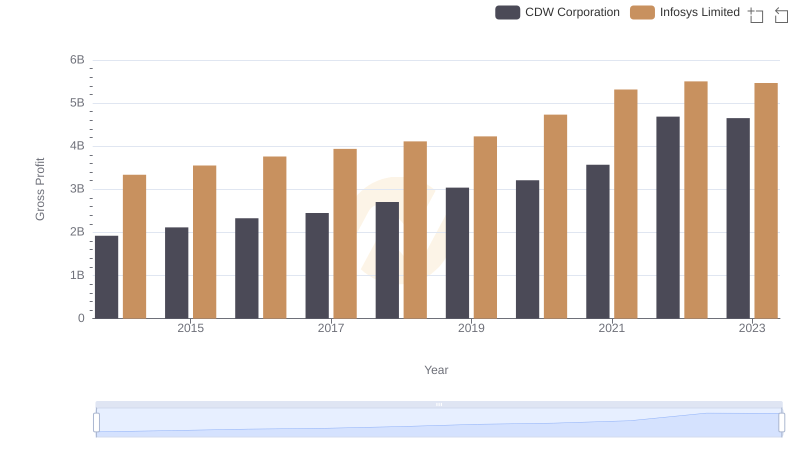
Who Generates Higher Gross Profit? Infosys Limited or CDW Corporation
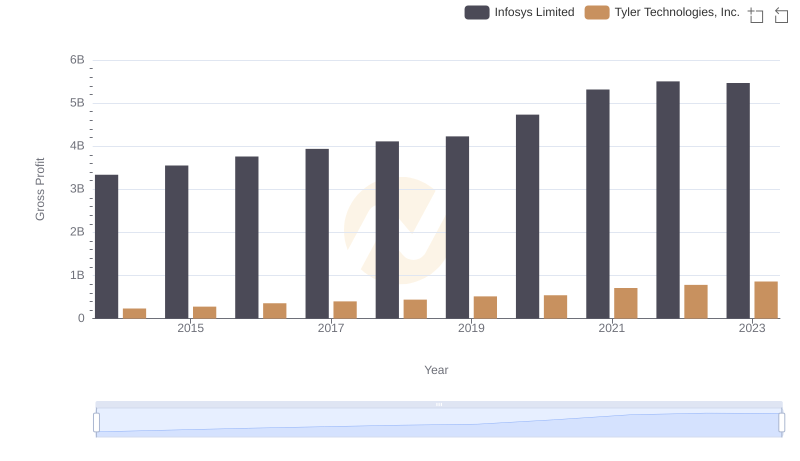
Gross Profit Trends Compared: Infosys Limited vs Tyler Technologies, Inc.
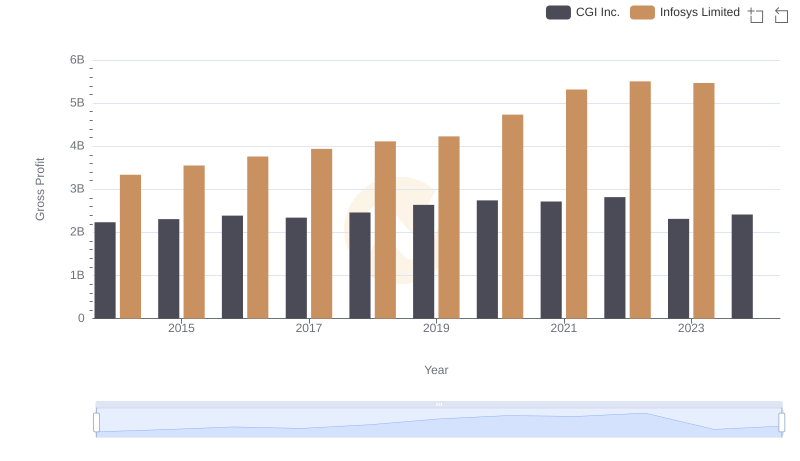
Gross Profit Comparison: Infosys Limited and CGI Inc. Trends
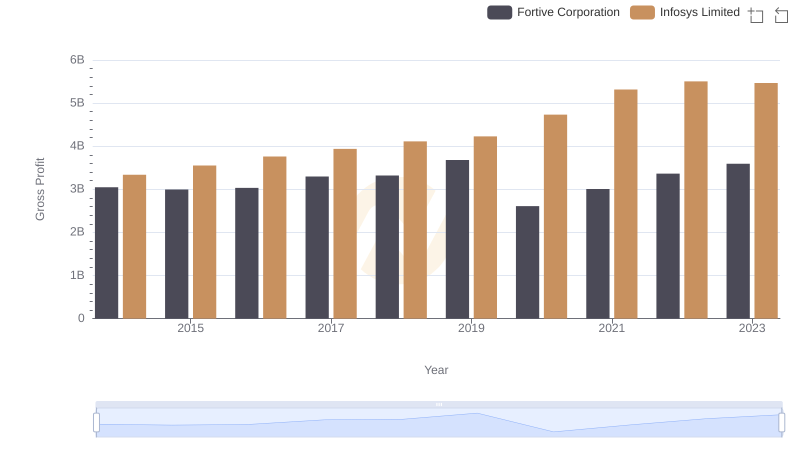
Infosys Limited and Fortive Corporation: A Detailed Gross Profit Analysis
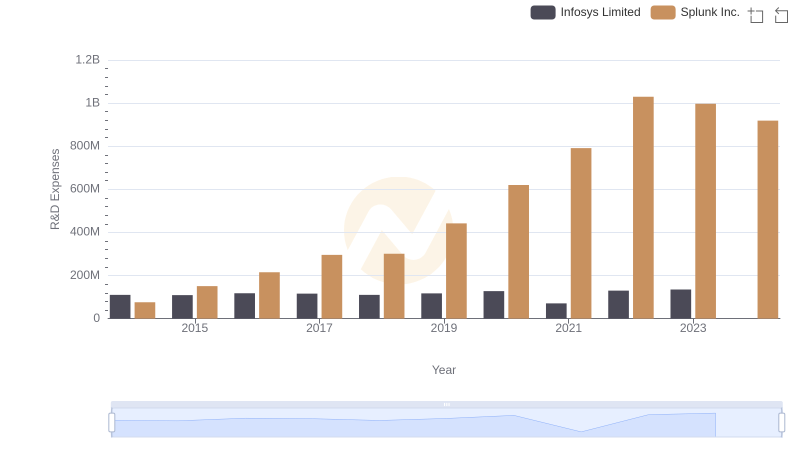
R&D Insights: How Infosys Limited and Splunk Inc. Allocate Funds
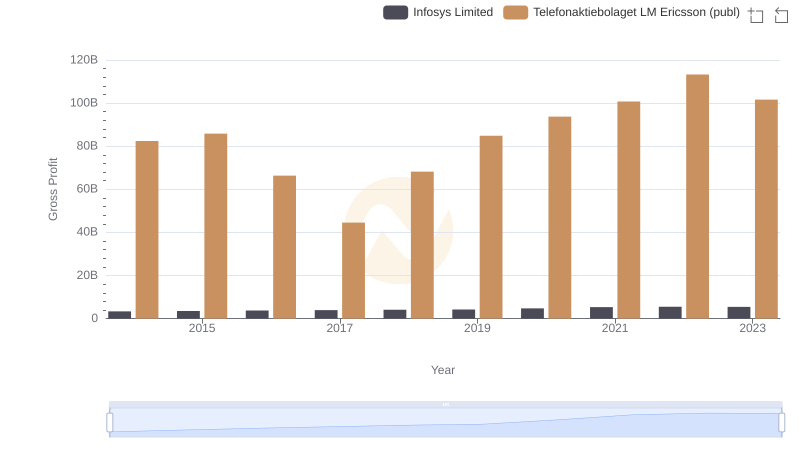
Who Generates Higher Gross Profit? Infosys Limited or Telefonaktiebolaget LM Ericsson (publ)
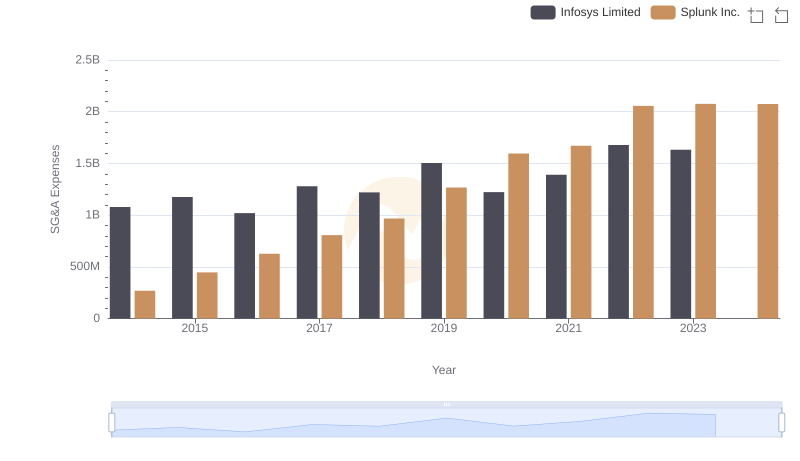
Infosys Limited vs Splunk Inc.: SG&A Expense Trends