| __timestamp | Fortive Corporation | Infosys Limited |
|---|---|---|
| Wednesday, January 1, 2014 | 1416300000 | 1079000000 |
| Thursday, January 1, 2015 | 1347900000 | 1176000000 |
| Friday, January 1, 2016 | 1402000000 | 1020000000 |
| Sunday, January 1, 2017 | 1537600000 | 1279000000 |
| Monday, January 1, 2018 | 1728600000 | 1220000000 |
| Tuesday, January 1, 2019 | 2219500000 | 1504000000 |
| Wednesday, January 1, 2020 | 1748400000 | 1223000000 |
| Friday, January 1, 2021 | 1839500000 | 1391000000 |
| Saturday, January 1, 2022 | 1956600000 | 1678000000 |
| Sunday, January 1, 2023 | 2062600000 | 1632000000 |
| Monday, January 1, 2024 | 2173500000 |
Unlocking the unknown
In the ever-evolving landscape of global business, understanding the financial strategies of leading corporations is crucial. This analysis delves into the Selling, General, and Administrative (SG&A) expenses of two industry giants: Infosys Limited and Fortive Corporation, from 2014 to 2023.
Over the past decade, Fortive Corporation has consistently outpaced Infosys Limited in SG&A expenses, reflecting a robust investment in operational and administrative capabilities. In 2023, Fortive's SG&A expenses were approximately 26% higher than Infosys, highlighting its aggressive growth strategy. Notably, Fortive's expenses surged by 45% from 2014 to 2023, while Infosys saw a 51% increase, indicating a significant expansion in their operational frameworks.
These trends underscore the strategic priorities of each company, with Fortive focusing on expansive operational investments and Infosys steadily enhancing its administrative efficiencies.
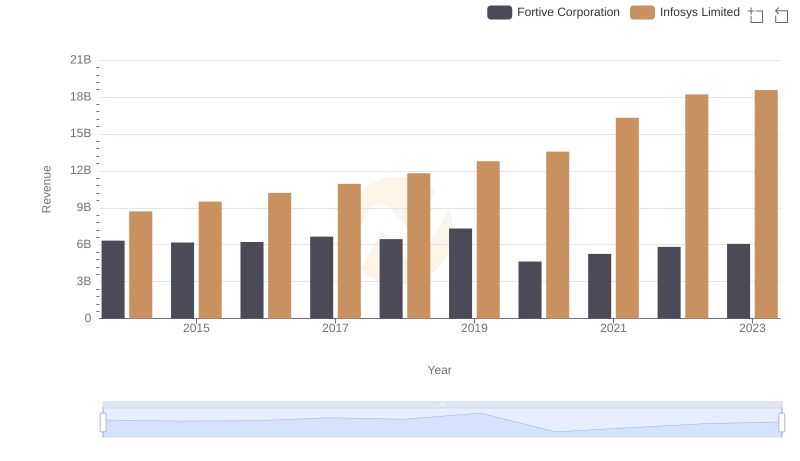
Who Generates More Revenue? Infosys Limited or Fortive Corporation
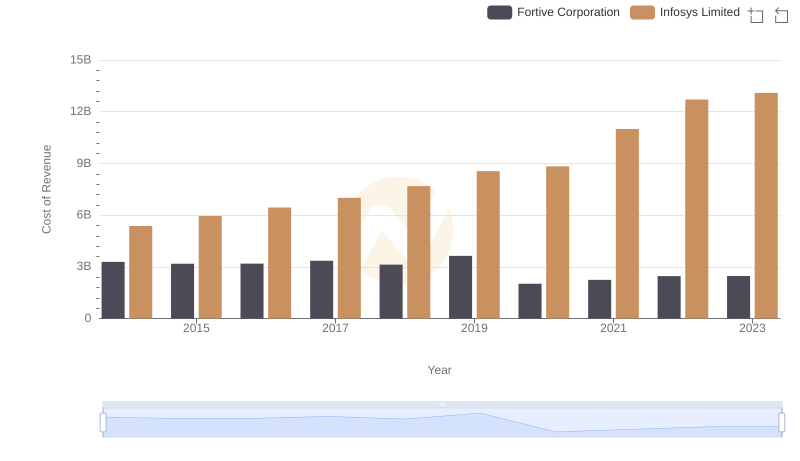
Comparing Cost of Revenue Efficiency: Infosys Limited vs Fortive Corporation
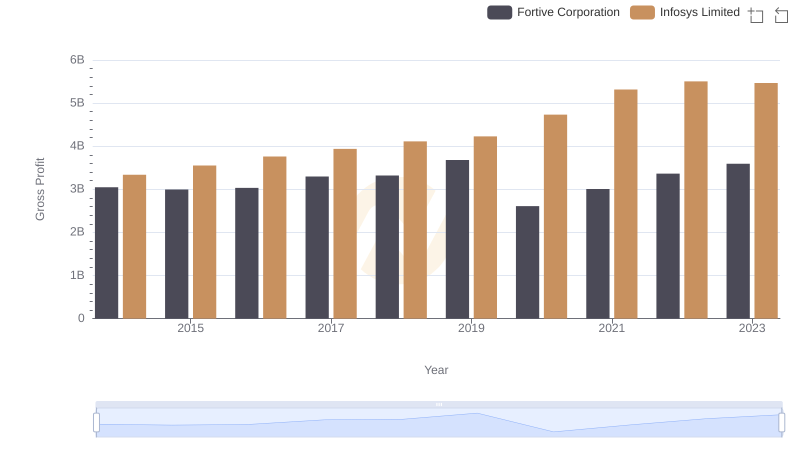
Infosys Limited and Fortive Corporation: A Detailed Gross Profit Analysis
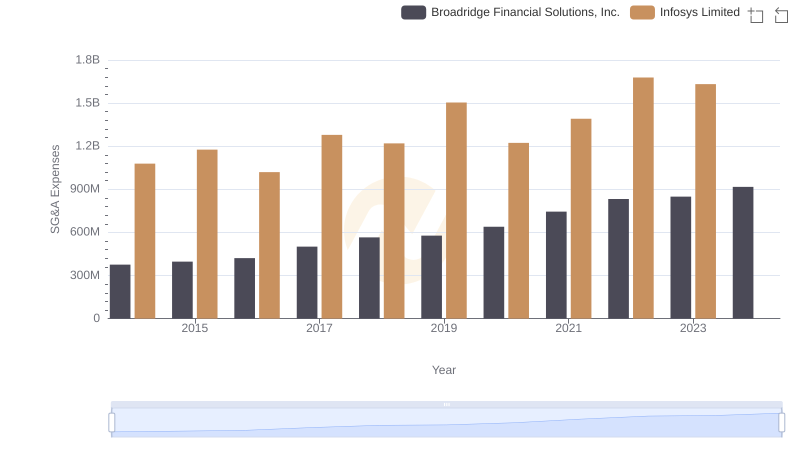
Comparing SG&A Expenses: Infosys Limited vs Broadridge Financial Solutions, Inc. Trends and Insights
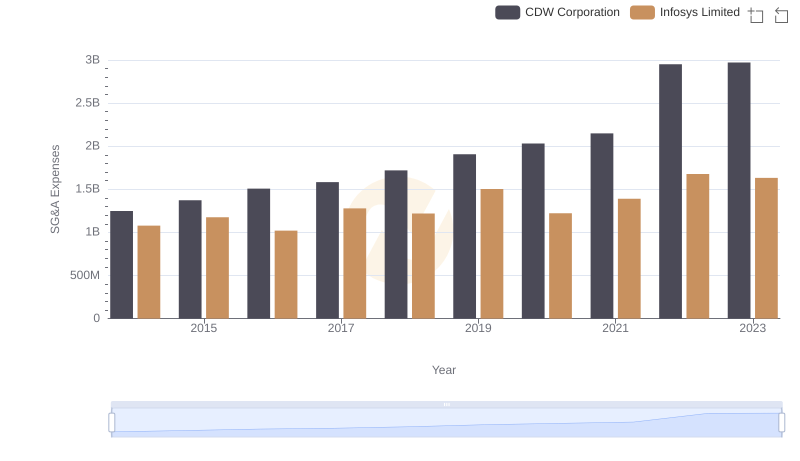
Operational Costs Compared: SG&A Analysis of Infosys Limited and CDW Corporation
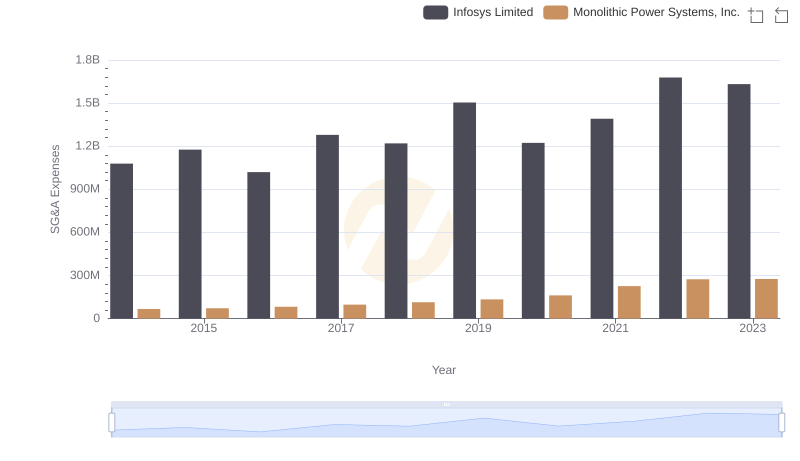
SG&A Efficiency Analysis: Comparing Infosys Limited and Monolithic Power Systems, Inc.
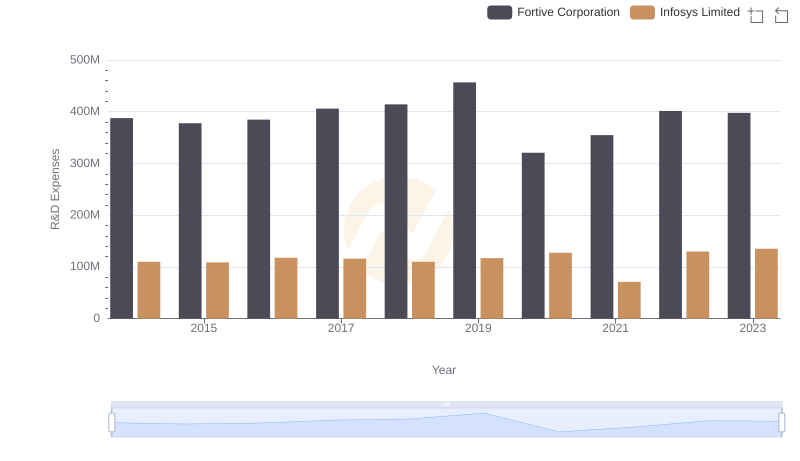
R&D Insights: How Infosys Limited and Fortive Corporation Allocate Funds
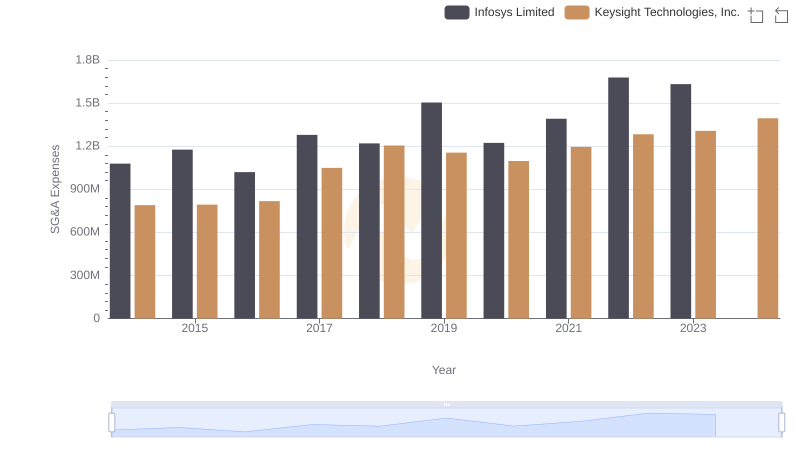
SG&A Efficiency Analysis: Comparing Infosys Limited and Keysight Technologies, Inc.
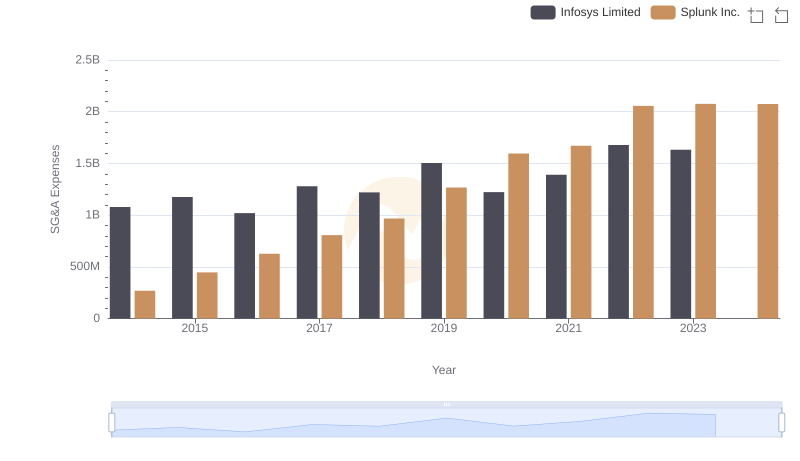
Infosys Limited vs Splunk Inc.: SG&A Expense Trends
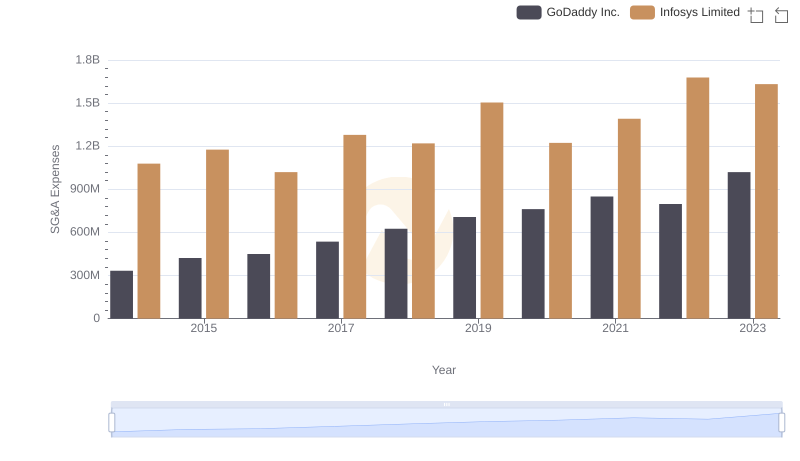
Selling, General, and Administrative Costs: Infosys Limited vs GoDaddy Inc.
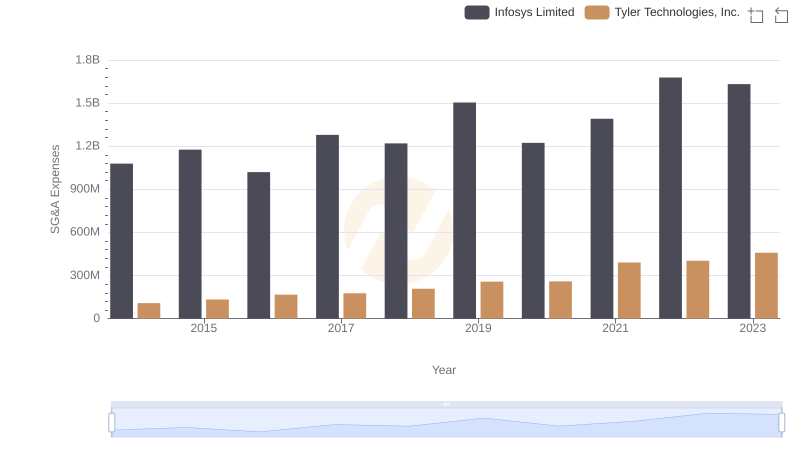
Selling, General, and Administrative Costs: Infosys Limited vs Tyler Technologies, Inc.
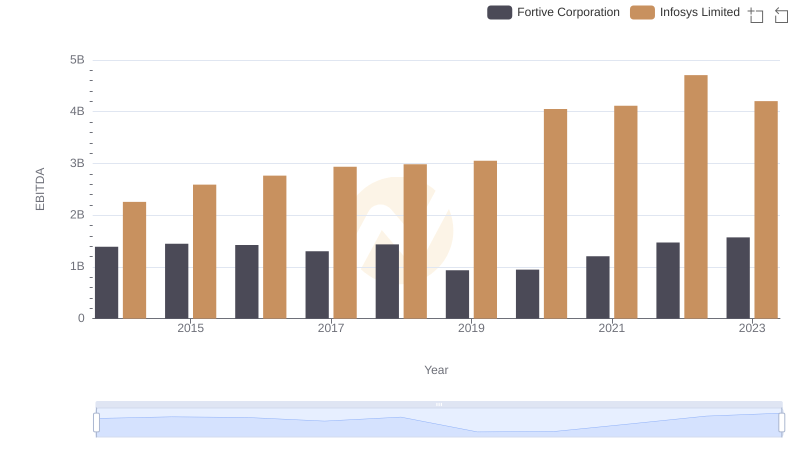
Comprehensive EBITDA Comparison: Infosys Limited vs Fortive Corporation