| __timestamp | Infosys Limited | Splunk Inc. |
|---|---|---|
| Wednesday, January 1, 2014 | 5374000000 | 35825000 |
| Thursday, January 1, 2015 | 5950000000 | 68378000 |
| Friday, January 1, 2016 | 6446000000 | 114122000 |
| Sunday, January 1, 2017 | 7001000000 | 191053000 |
| Monday, January 1, 2018 | 7687000000 | 256409000 |
| Tuesday, January 1, 2019 | 8552000000 | 344676000 |
| Wednesday, January 1, 2020 | 8828000000 | 429788000 |
| Friday, January 1, 2021 | 10996000000 | 547345000 |
| Saturday, January 1, 2022 | 12709000000 | 733969000 |
| Sunday, January 1, 2023 | 13096000000 | 815995000 |
| Monday, January 1, 2024 | 865507000 |
In pursuit of knowledge
In the ever-evolving landscape of technology, cost efficiency remains a pivotal factor for success. This analysis delves into the cost of revenue trends for Infosys Limited and Splunk Inc. from 2014 to 2023. Over this decade, Infosys has consistently demonstrated robust cost management, with its cost of revenue growing by approximately 144%, from $5.37 billion in 2014 to $13.1 billion in 2023. In contrast, Splunk Inc. has shown a more dynamic growth trajectory, with its cost of revenue surging by over 2,200%, from $35.8 million to $815.9 million in the same period.
While Infosys's steady growth reflects its established market presence, Splunk's rapid increase highlights its aggressive expansion strategy. However, the data for 2024 remains incomplete, leaving room for speculation on future trends. This comparison underscores the diverse strategies employed by tech giants in managing their operational costs.
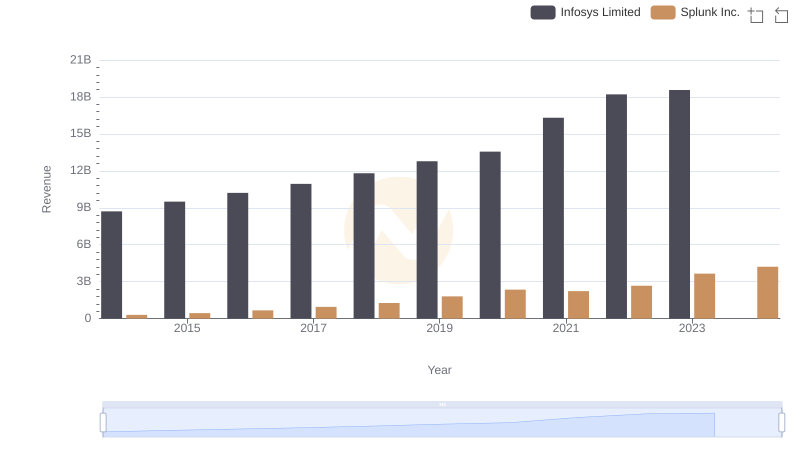
Breaking Down Revenue Trends: Infosys Limited vs Splunk Inc.
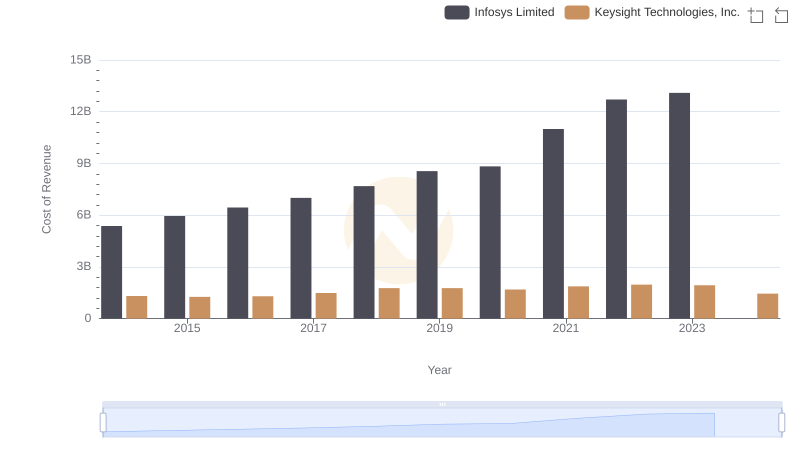
Cost Insights: Breaking Down Infosys Limited and Keysight Technologies, Inc.'s Expenses
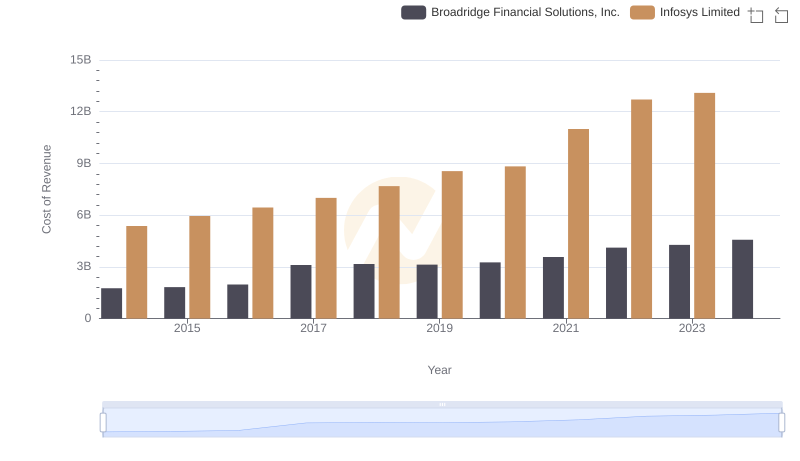
Comparing Cost of Revenue Efficiency: Infosys Limited vs Broadridge Financial Solutions, Inc.
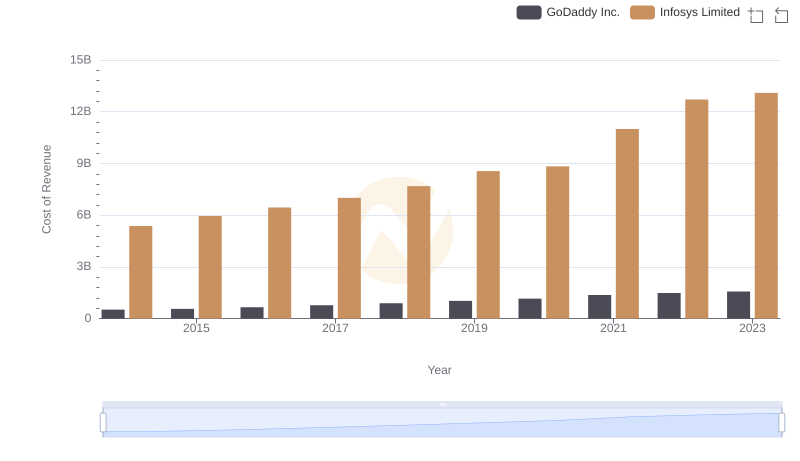
Cost of Revenue: Key Insights for Infosys Limited and GoDaddy Inc.
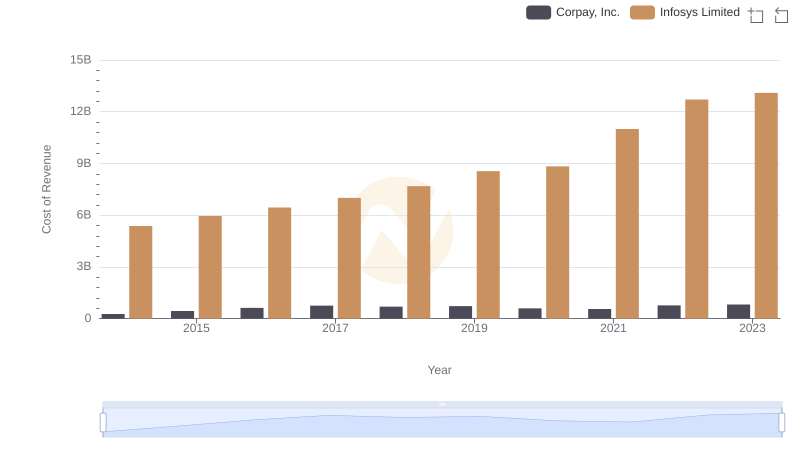
Analyzing Cost of Revenue: Infosys Limited and Corpay, Inc.
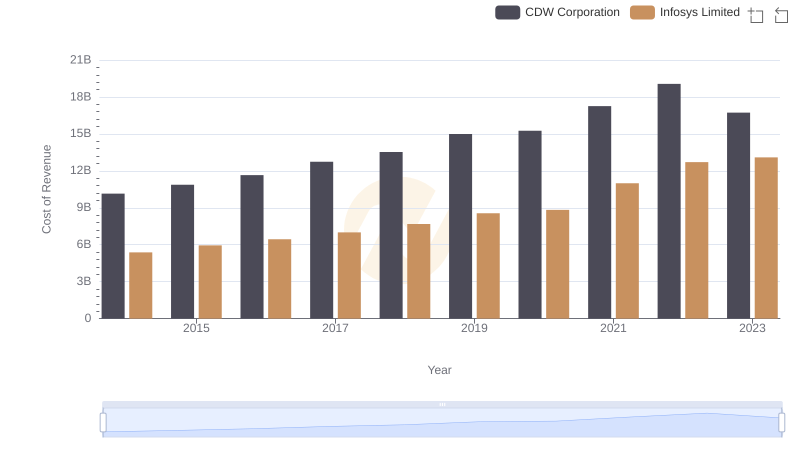
Cost of Revenue: Key Insights for Infosys Limited and CDW Corporation
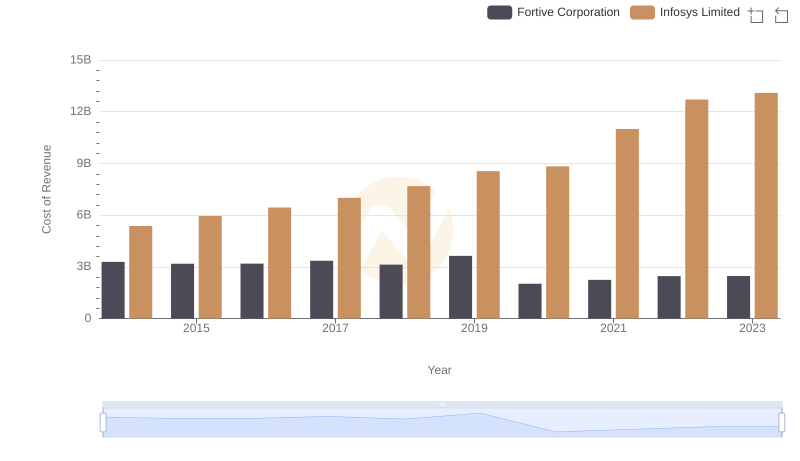
Comparing Cost of Revenue Efficiency: Infosys Limited vs Fortive Corporation
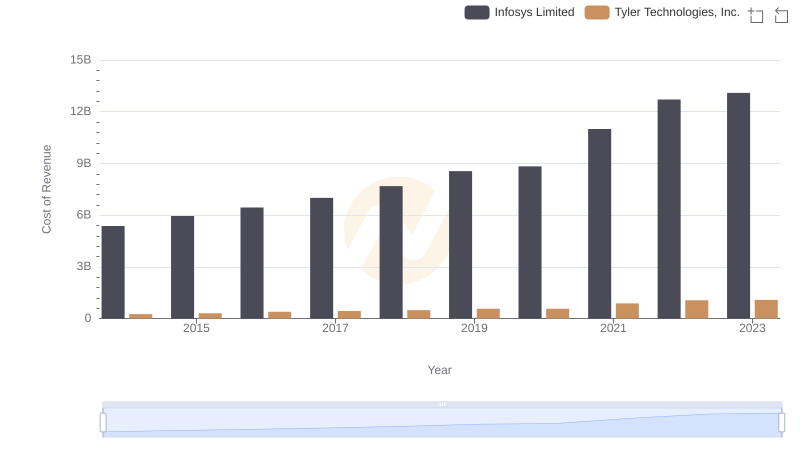
Cost of Revenue: Key Insights for Infosys Limited and Tyler Technologies, Inc.
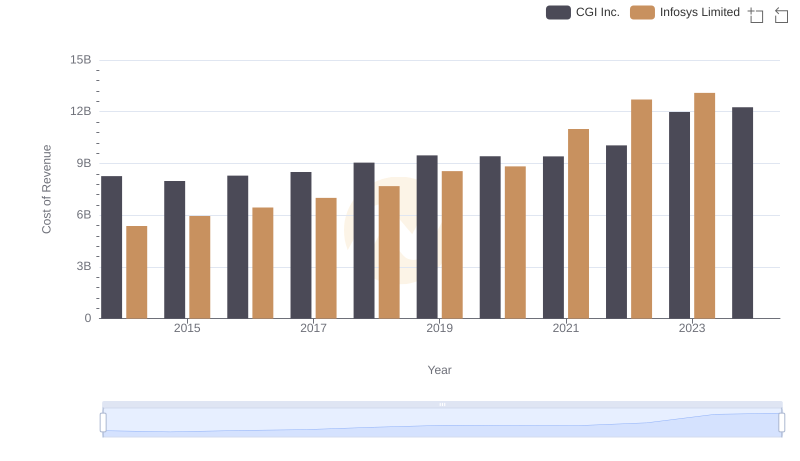
Analyzing Cost of Revenue: Infosys Limited and CGI Inc.
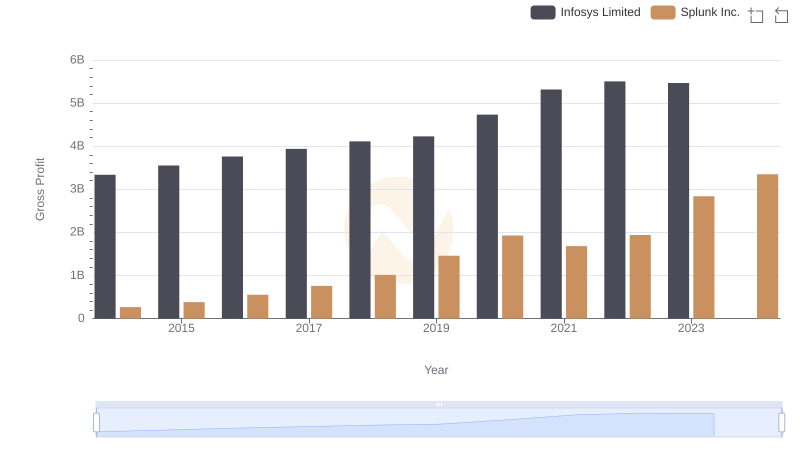
Infosys Limited and Splunk Inc.: A Detailed Gross Profit Analysis
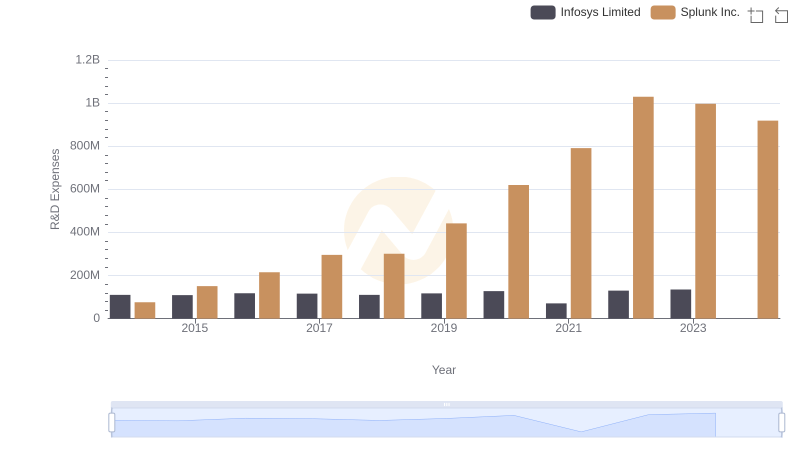
R&D Insights: How Infosys Limited and Splunk Inc. Allocate Funds
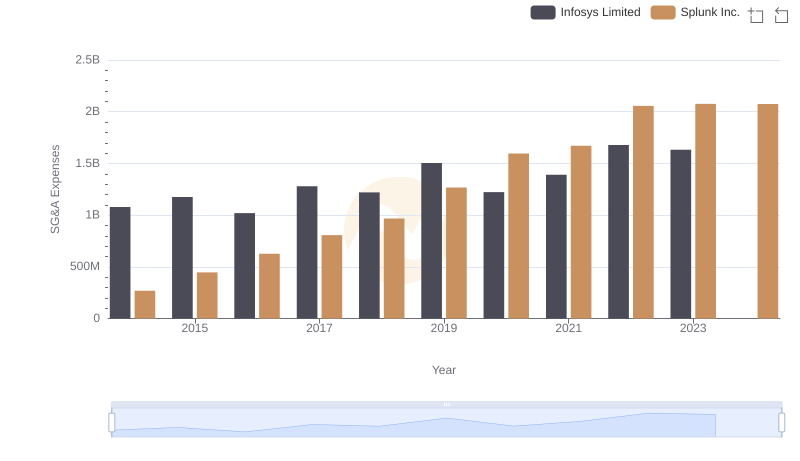
Infosys Limited vs Splunk Inc.: SG&A Expense Trends