| __timestamp | ANSYS, Inc. | Infosys Limited |
|---|---|---|
| Wednesday, January 1, 2014 | 246376000 | 1079000000 |
| Thursday, January 1, 2015 | 253603000 | 1176000000 |
| Friday, January 1, 2016 | 269515000 | 1020000000 |
| Sunday, January 1, 2017 | 338640000 | 1279000000 |
| Monday, January 1, 2018 | 413580000 | 1220000000 |
| Tuesday, January 1, 2019 | 521200000 | 1504000000 |
| Wednesday, January 1, 2020 | 587707000 | 1223000000 |
| Friday, January 1, 2021 | 715377000 | 1391000000 |
| Saturday, January 1, 2022 | 772871000 | 1678000000 |
| Sunday, January 1, 2023 | 855135000 | 1632000000 |
| Monday, January 1, 2024 | 995340000 |
Unveiling the hidden dimensions of data
In the ever-evolving landscape of global technology, understanding the financial strategies of industry leaders is crucial. This analysis delves into the Selling, General, and Administrative (SG&A) expenses of two tech titans: Infosys Limited and ANSYS, Inc., from 2014 to 2023.
Over the past decade, Infosys Limited has consistently outpaced ANSYS, Inc. in SG&A expenses, reflecting its expansive operational scale. In 2023, Infosys's SG&A expenses were approximately 1.9 times higher than those of ANSYS. However, ANSYS has shown a remarkable growth trajectory, with its SG&A expenses increasing by nearly 247% from 2014 to 2023.
This trend highlights ANSYS's aggressive investment in administrative capabilities, potentially signaling a strategic pivot towards scaling operations. Meanwhile, Infosys's steady expenditure underscores its established market presence and sustained growth strategy. These insights offer a window into the financial priorities and strategic directions of these industry leaders.
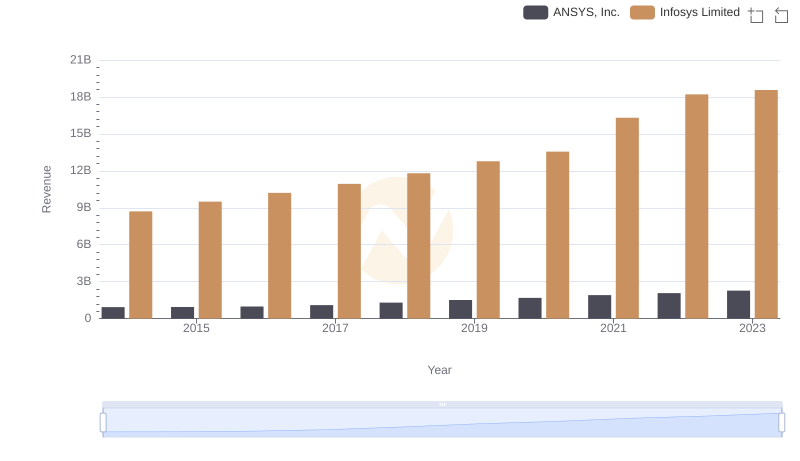
Infosys Limited or ANSYS, Inc.: Who Leads in Yearly Revenue?
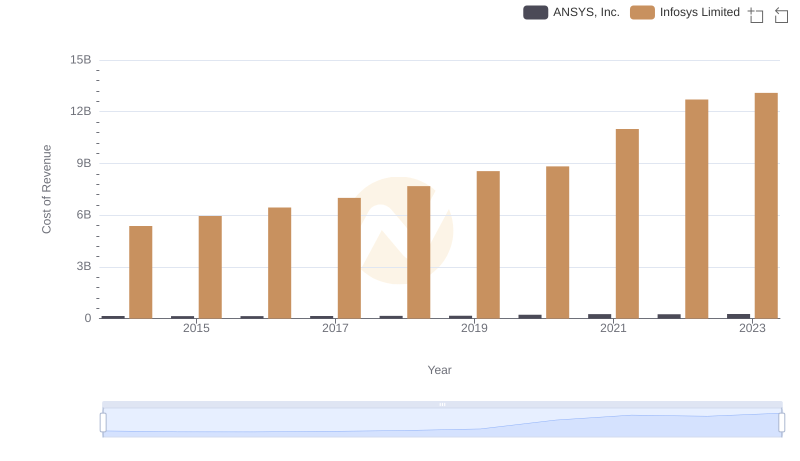
Cost of Revenue Trends: Infosys Limited vs ANSYS, Inc.
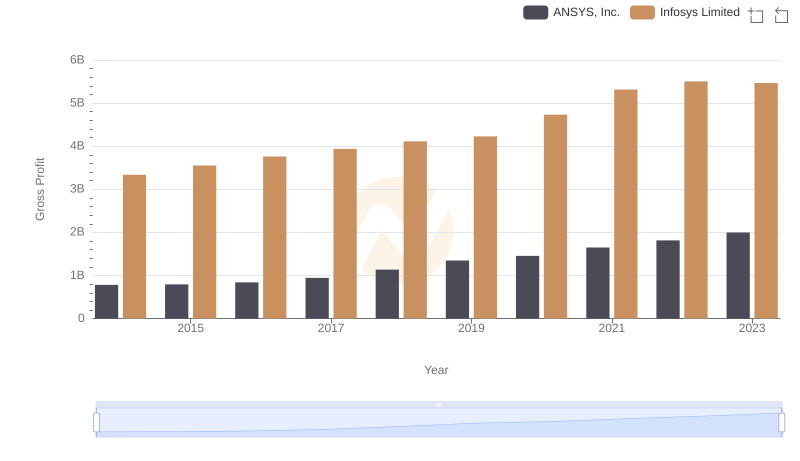
Key Insights on Gross Profit: Infosys Limited vs ANSYS, Inc.
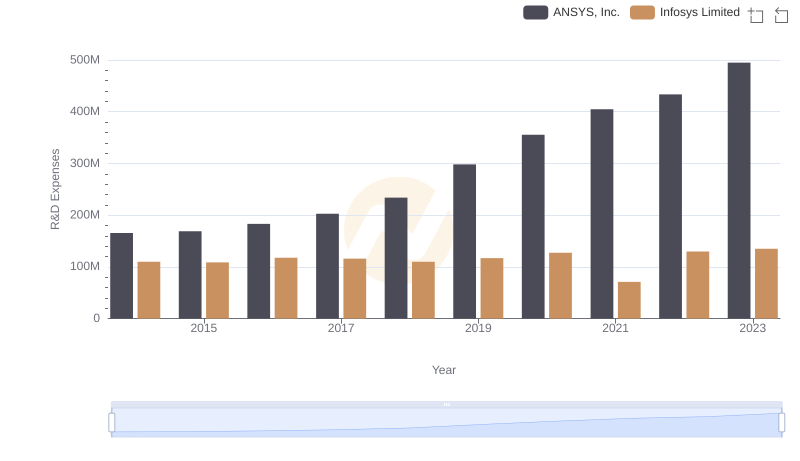
Who Prioritizes Innovation? R&D Spending Compared for Infosys Limited and ANSYS, Inc.
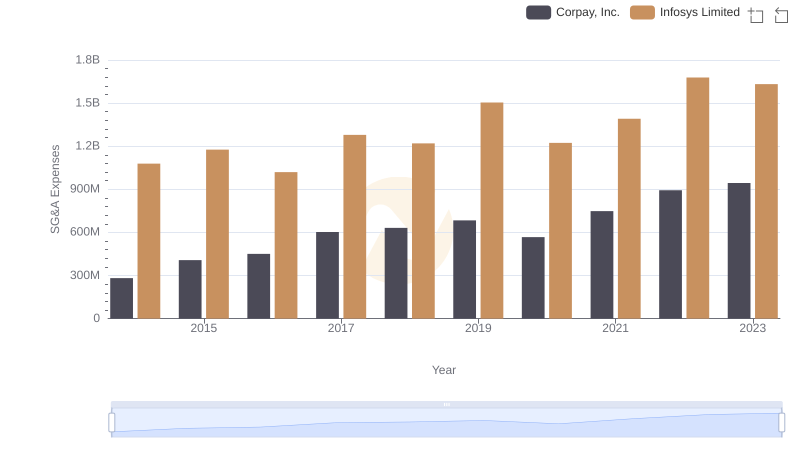
Comparing SG&A Expenses: Infosys Limited vs Corpay, Inc. Trends and Insights
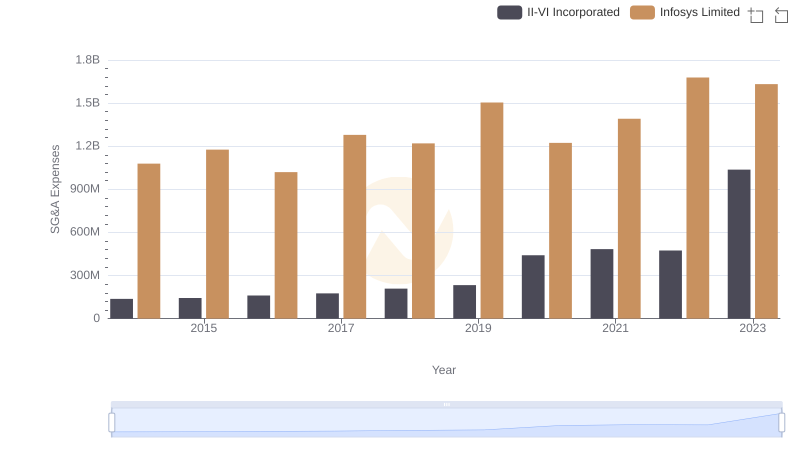
Cost Management Insights: SG&A Expenses for Infosys Limited and II-VI Incorporated
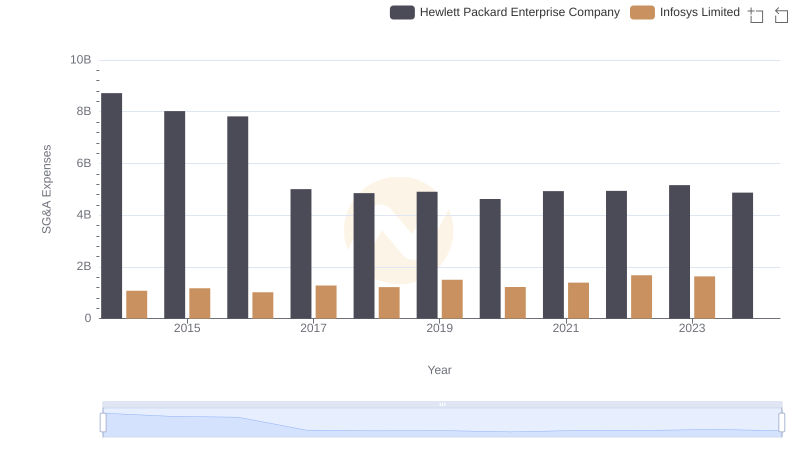
Who Optimizes SG&A Costs Better? Infosys Limited or Hewlett Packard Enterprise Company
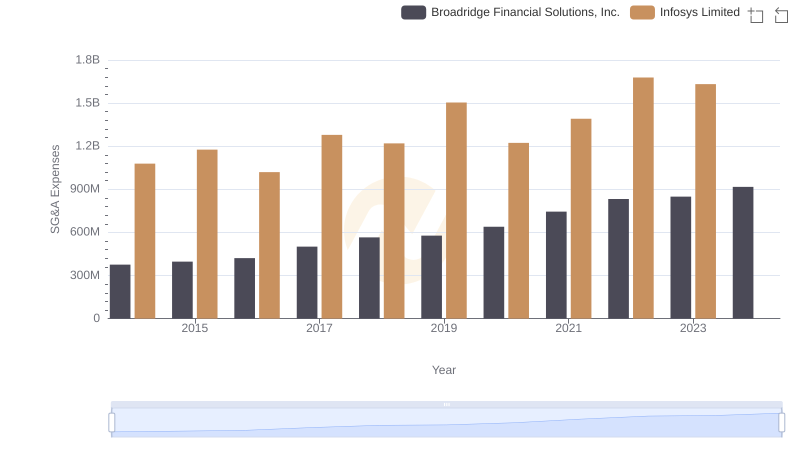
Comparing SG&A Expenses: Infosys Limited vs Broadridge Financial Solutions, Inc. Trends and Insights
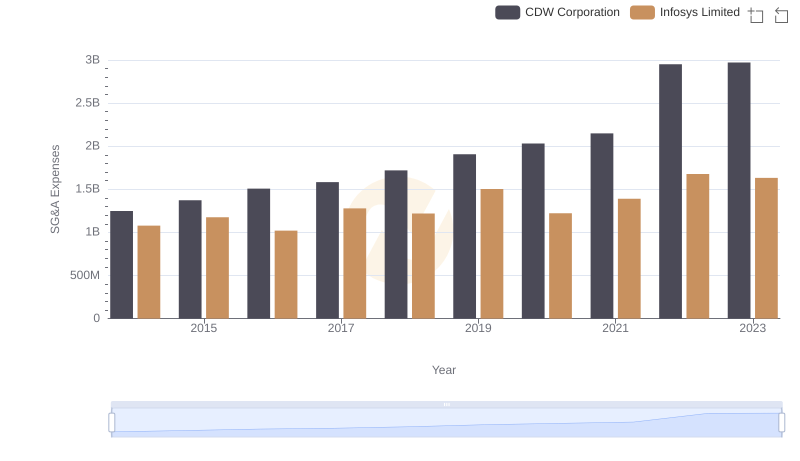
Operational Costs Compared: SG&A Analysis of Infosys Limited and CDW Corporation
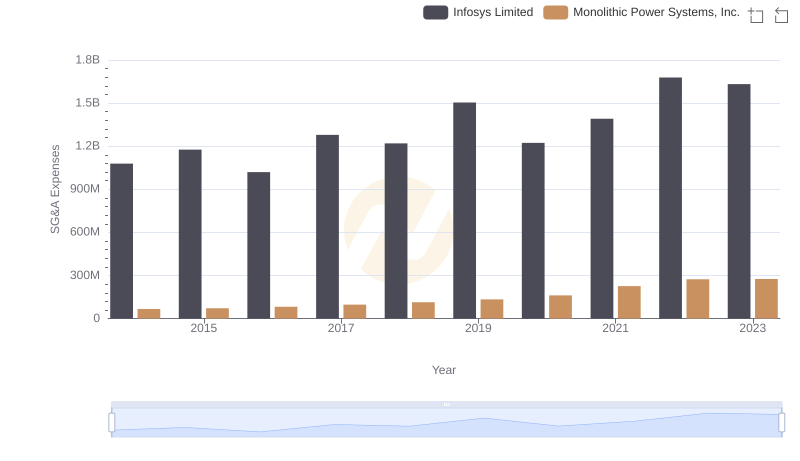
SG&A Efficiency Analysis: Comparing Infosys Limited and Monolithic Power Systems, Inc.
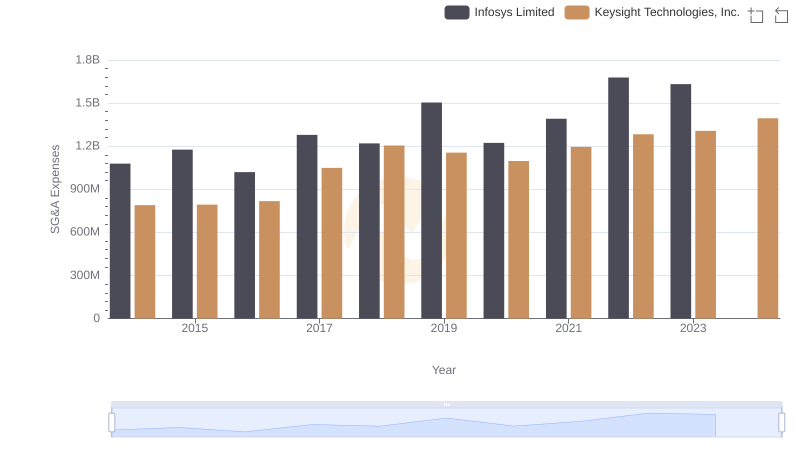
SG&A Efficiency Analysis: Comparing Infosys Limited and Keysight Technologies, Inc.
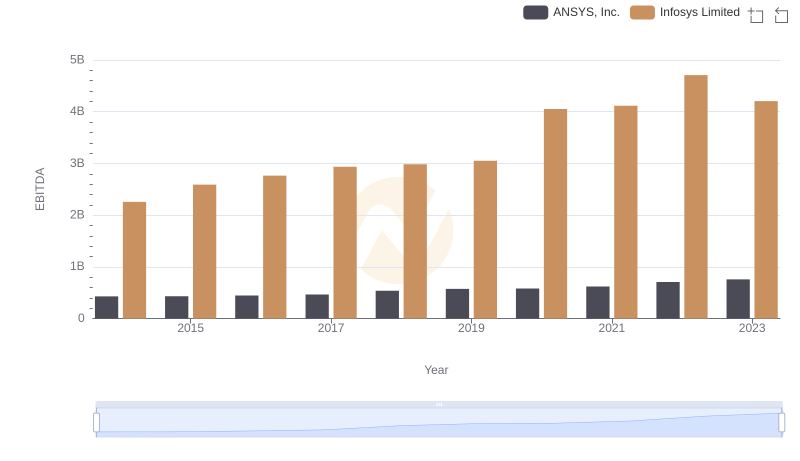
EBITDA Performance Review: Infosys Limited vs ANSYS, Inc.